Security News
Research
Data Theft Repackaged: A Case Study in Malicious Wrapper Packages on npm
The Socket Research Team breaks down a malicious wrapper package that uses obfuscation to harvest credentials and exfiltrate sensitive data.
@envelop/opentelemetry
Advanced tools
This plugins integrates [Open Telemetry](https://opentelemetry.io/) tracing with your GraphQL execution. It also collects GraphQL execution errors and reports it as Exceptions.
@envelop/opentelemetryThis plugins integrates Open Telemetry tracing with your GraphQL execution. It also collects GraphQL execution errors and reports it as Exceptions.
You can use this plugin with any kind of Open Telemetry tracer, and integrate it to any tracing/metric platform that supports this standard.
yarn add @envelop/opentelemetry
By default, this plugin prints the collected telemetry to the console:
import { execute, parse, specifiedRules, subscribe, validate } from 'graphql'
import { envelop, useEngine } from '@envelop/core'
import { useOpenTelemetry } from '@envelop/opentelemetry'

const getEnveloped = envelop({
  plugins: [
    useEngine({ parse, validate, specifiedRules, execute, subscribe }),
    // ... other plugins ...
    useOpenTelemetry({
      resolvers: true, // Tracks resolvers calls, and tracks resolvers thrown errors
      variables: true, // Includes the operation variables values as part of the metadata collected
      result: true // Includes execution result object as part of the metadata collected
    })
  ]
})
@opentelemetry packagesBy default, this plugin is creating a console exporter for exporting the Spans.
If you wish to use custom tracer/exporter, create it and pass it to the plugin factory function.
The following example is taking the current global tracer:
import { execute, parse, specifiedRules, subscribe, validate } from 'graphql'
import { envelop, useEngine } from '@envelop/core'
import { useOpenTelemetry } from '@envelop/opentelemetry'
import { trace } from '@opentelemetry/api'
import { BasicTracerProvider, SimpleSpanProcessor } from '@opentelemetry/sdk-trace-base'

const getEnveloped = envelop({
  plugins: [
    useEngine({ parse, validate, specifiedRules, execute, subscribe }),
    // ... other plugins ...
    useOpenTelemetry(
      {
        resolvers: true, // Tracks resolvers calls, and tracks resolvers thrown errors
        variables: true, // Includes the operation variables values as part of the metadata collected
        result: true // Includes execution result object as part of the metadata collected
      },
      trace.getTracerProvider()
    )
  ]
})
This example integrates Jaeger tracer. To use this example, start by running Jaeger locally in a Docker container (or, follow other options to run Jaeger locally):
docker run -d --name jaeger \
  -e COLLECTOR_ZIPKIN_HTTP_PORT=9411 \
  -p 5775:5775/udp \
  -p 6831:6831/udp \
  -p 6832:6832/udp \
  -p 5778:5778 \
  -p 16686:16686 \
  -p 14268:14268 \
  -p 9411:9411 \
  jaegertracing/all-in-one:latest
import { execute, parse, specifiedRules, subscribe, validate } from 'graphql'
import { envelop, useEngine } from '@envelop/core'
import { useOpenTelemetry } from '@envelop/opentelemetry'
import { JaegerExporter } from '@opentelemetry/exporter-jaeger'
import { BasicTracerProvider, SimpleSpanProcessor } from '@opentelemetry/sdk-trace-base'

// Create your exporter
const exporter = new JaegerExporter({
  serviceName: 'my-service-name',
  host: 'localhost',
  port: 6832
})

// Configure opentelmetry to run for your service
const provider = new BasicTracerProvider()
provider.addSpanProcessor(new SimpleSpanProcessor(exporter))
provider.register()

const getEnveloped = envelop({
  plugins: [
    useEngine({ parse, validate, specifiedRules, execute, subscribe }),
    // ... other plugins ...
    useOpenTelemetry(
      {
        resolvers: true, // Tracks resolvers calls, and tracks resolvers thrown errors
        variables: true, // Includes the operation variables values as part of the metadata collected
        result: true // Includes execution result object as part of the metadata collected
      },
      provider
    )
  ]
})
FAQs
This plugins integrates [Open Telemetry](https://opentelemetry.io/) tracing with your GraphQL execution. It also collects GraphQL execution errors and reports it as Exceptions.
We found that @envelop/opentelemetry demonstrated a healthy version release cadence and project activity because the last version was released less than a year ago. It has 1 open source maintainer collaborating on the project.
Did you know?

Socket for GitHub automatically highlights issues in each pull request and monitors the health of all your open source dependencies. Discover the contents of your packages and block harmful activity before you install or update your dependencies.

Security News
Research
The Socket Research Team breaks down a malicious wrapper package that uses obfuscation to harvest credentials and exfiltrate sensitive data.

Research
Security News
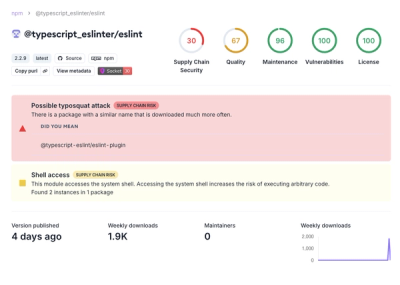
Attackers used a malicious npm package typosquatting a popular ESLint plugin to steal sensitive data, execute commands, and exploit developer systems.

Security News
The Ultralytics' PyPI Package was compromised four times in one weekend through GitHub Actions cache poisoning and failure to rotate previously compromised API tokens.