angular2-google-chart
Advanced tools
angular2-google-chart - npm Package Compare versions
Comparing version 1.1.3 to 1.1.4
@@ -26,3 +26,3 @@ System.register(['@angular/core'], function(exports_1, context_1) { | ||
| } | ||
| GoogleChart.prototype.ngOnInit = function () { | ||
| GoogleChart.prototype.ngOnChanges = function () { | ||
| var _this = this; | ||
@@ -42,6 +42,5 @@ if (!googleLoaded) { | ||
| dataTable: chartData, | ||
| options: chartOptions || {}, | ||
| containerId: ele.id | ||
| options: chartOptions || {} | ||
| }); | ||
| wrapper.draw(); | ||
| wrapper.draw(ele); | ||
| } | ||
@@ -48,0 +47,0 @@ }; |
@@ -1,12 +0,15 @@ | ||
| import {Directive,ElementRef,Input,OnInit} from '@angular/core'; | ||
| declare var google:any; | ||
| declare var googleLoaded:any; | ||
| import {Directive, ElementRef, Input, OnInit} from '@angular/core'; | ||
| declare var google: any; | ||
| declare var googleLoaded: any; | ||
| declare var googleChartsPackagesToLoad: any; | ||
| @Directive({ | ||
| selector: '[GoogleChart]', | ||
| // properties: [ | ||
| // 'chartType', | ||
| // 'chartOptions', | ||
| // 'chartData' | ||
| // ] | ||
| selector: '[GoogleChart]', | ||
| // properties: [ | ||
| // 'chartType', | ||
| // 'chartOptions', | ||
| // 'chartData' | ||
| // ] | ||
| }) | ||
| export class GoogleChart implements OnInit { | ||
@@ -20,3 +23,3 @@ public _element:any; | ||
| } | ||
| ngOnInit() { | ||
| ngOnChanges() { | ||
| if(!googleLoaded) { | ||
@@ -35,9 +38,8 @@ googleLoaded = true; | ||
| dataTable:chartData , | ||
| options:chartOptions || {}, | ||
| containerId: ele.id | ||
| options:chartOptions || {} | ||
| }); | ||
| wrapper.draw(); | ||
| wrapper.draw(ele); | ||
| } | ||
| } | ||
| } | ||
| } |
@@ -76,6 +76,16 @@ /* | ||
| ['Philadelphia, PA', 1526000, 1517000]]; | ||
| this.map_ChartData = [ | ||
| ['Country', 'Popularity'], | ||
| ['Germany', 200], | ||
| ['United States', 300], | ||
| ['Brazil', 400], | ||
| ['Canada', 500], | ||
| ['France', 600], | ||
| ['RU', 700] | ||
| ]; | ||
| this.line_ChartOptions = { | ||
| title: 'Company Performance', | ||
| curveType: 'function', | ||
| legend: { position: 'bottom' | ||
| legend: { | ||
| position: 'bottom' | ||
| } | ||
@@ -99,3 +109,4 @@ }; | ||
| this.scatter_ChartOptions = { | ||
| legend: { position: 'bottom' | ||
| legend: { | ||
| position: 'bottom' | ||
| }, | ||
@@ -162,2 +173,3 @@ title: 'Company Sales Percentage' | ||
| }; | ||
| this.map_ChartOptions = {}; | ||
| } | ||
@@ -167,3 +179,3 @@ AppComponent = __decorate([ | ||
| selector: 'my-app', | ||
| template: "\n <h2> Gaugh Chart</h2>\n <div id=\"gauge_chart\" [chartData]=\"gauge_ChartData\" [chartOptions]= \"gauge_ChartOptions\" chartType=\"Gauge\" GoogleChart></div>\n <h2> Area Chart</h2>\n <div id=\"area_chart\" [chartData]=\"area_ChartData\" [chartOptions]= \"area_ChartOptions\" chartType=\"AreaChart\" GoogleChart></div>\n <h2> Line Chart</h2>\n <div id=\"line_chart\" [chartData]=\"line_ChartData\" [chartOptions]= \"line_ChartOptions\" chartType=\"LineChart\" GoogleChart></div>\n <h2> Bubble Chart</h2>\n <div id=\"bubble_chart\" [chartData]=\"bubble_ChartData\" [chartOptions] = \"bubble_ChartOptions\" chartType=\"BubbleChart\" GoogleChart></div>\n <h2> Scatter Chart</h2>\n <div id=\"scatter_chart\" [chartData]=\"scatter_ChartData\" [chartOptions] = \"scatter_ChartOptions\" chartType=\"ScatterChart\" GoogleChart></div>\n <h2> CandlestickChart</h2>\n <div id=\"candle_chart\" [chartData]=\"candle_ChartData\" [chartOptions] = \"candle_ChartOptions\" chartType=\"CandlestickChart\" GoogleChart></div> \n <h2> Pie Chart</h2>\n <div id=\"pie_chart\" [chartData]=\"pie_ChartData\" [chartOptions] = \"pie_ChartOptions\" chartType=\"PieChart\" GoogleChart></div> \n <h2> Bar Chart</h2>\n <div id=\"bar_chart\" [chartData]=\"bar_ChartData\" [chartOptions] = \"bar_ChartOptions\" chartType=\"BarChart\" GoogleChart></div>\n\t\n\t" | ||
| template: "\n <h2> Gaugh Chart</h2>\n <div id=\"gauge_chart\" [chartData]=\"gauge_ChartData\" [chartOptions]= \"gauge_ChartOptions\" chartType=\"Gauge\" GoogleChart></div>\n <h2> Area Chart</h2>\n <div id=\"area_chart\" [chartData]=\"area_ChartData\" [chartOptions]= \"area_ChartOptions\" chartType=\"AreaChart\" GoogleChart></div>\n <h2> Line Chart</h2>\n <div id=\"line_chart\" [chartData]=\"line_ChartData\" [chartOptions]= \"line_ChartOptions\" chartType=\"LineChart\" GoogleChart></div>\n <h2> Bubble Chart</h2>\n <div id=\"bubble_chart\" [chartData]=\"bubble_ChartData\" [chartOptions] = \"bubble_ChartOptions\" chartType=\"BubbleChart\" GoogleChart></div>\n <h2> Scatter Chart</h2>\n <div id=\"scatter_chart\" [chartData]=\"scatter_ChartData\" [chartOptions] = \"scatter_ChartOptions\" chartType=\"ScatterChart\" GoogleChart></div>\n <h2> CandlestickChart</h2>\n <div id=\"candle_chart\" [chartData]=\"candle_ChartData\" [chartOptions] = \"candle_ChartOptions\" chartType=\"CandlestickChart\" GoogleChart></div>\n <h2> Pie Chart</h2>\n <div id=\"pie_chart\" [chartData]=\"pie_ChartData\" [chartOptions] = \"pie_ChartOptions\" chartType=\"PieChart\" GoogleChart></div>\n <h2> Bar Chart</h2>\n <div id=\"bar_chart\" [chartData]=\"bar_ChartData\" [chartOptions] = \"bar_ChartOptions\" chartType=\"BarChart\" GoogleChart></div>\n <h2> Map Chart</h2>\n <div id=\"map_chart\" [chartData]=\"map_ChartData\" [chartOptions] = \"map_ChartOptions\" chartType=\"GeoChart\" GoogleChart></div>\n\n\t" | ||
| }), | ||
@@ -170,0 +182,0 @@ __metadata('design:paramtypes', []) |
@@ -1,2 +0,2 @@ | ||
| /* | ||
| /* | ||
| * @author Vimala A | ||
@@ -7,4 +7,4 @@ */ | ||
| @Component({ | ||
| selector : 'my-app', | ||
| template: ` | ||
| selector: 'my-app', | ||
| template: ` | ||
| <h2> Gaugh Chart</h2> | ||
@@ -21,147 +21,161 @@ <div id="gauge_chart" [chartData]="gauge_ChartData" [chartOptions]= "gauge_ChartOptions" chartType="Gauge" GoogleChart></div> | ||
| <h2> CandlestickChart</h2> | ||
| <div id="candle_chart" [chartData]="candle_ChartData" [chartOptions] = "candle_ChartOptions" chartType="CandlestickChart" GoogleChart></div> | ||
| <div id="candle_chart" [chartData]="candle_ChartData" [chartOptions] = "candle_ChartOptions" chartType="CandlestickChart" GoogleChart></div> | ||
| <h2> Pie Chart</h2> | ||
| <div id="pie_chart" [chartData]="pie_ChartData" [chartOptions] = "pie_ChartOptions" chartType="PieChart" GoogleChart></div> | ||
| <div id="pie_chart" [chartData]="pie_ChartData" [chartOptions] = "pie_ChartOptions" chartType="PieChart" GoogleChart></div> | ||
| <h2> Bar Chart</h2> | ||
| <div id="bar_chart" [chartData]="bar_ChartData" [chartOptions] = "bar_ChartOptions" chartType="BarChart" GoogleChart></div> | ||
| ` | ||
| <h2> Map Chart</h2> | ||
| <div id="map_chart" [chartData]="map_ChartData" [chartOptions] = "map_ChartOptions" chartType="GeoChart" GoogleChart></div> | ||
| ` | ||
| }) | ||
| export class AppComponent { | ||
| public line_ChartData = [ | ||
| ['Year', 'Sales', 'Expenses'], | ||
| ['2004', 1000, 400], | ||
| ['2005', 1170, 460], | ||
| ['2006', 660, 1120], | ||
| ['2007', 1030, 540]]; | ||
| public bubble_ChartData = [ | ||
| ['ID', 'Life Expectancy', 'Fertility Rate', 'Region', 'Population'], | ||
| ['CAN', 80.66, 1.67, 'North America', 33739900], | ||
| ['DEU', 79.84, 1.36, 'Europe', 81902307], | ||
| ['DNK', 78.6, 1.84, 'Europe', 5523095], | ||
| ['EGY', 72.73, 2.78, 'Middle East', 79716203], | ||
| ['GBR', 80.05, 2, 'Europe', 61801570], | ||
| ['IRN', 72.49, 1.7, 'Middle East', 73137148], | ||
| ['IRQ', 68.09, 4.77, 'Middle East', 31090763], | ||
| ['ISR', 81.55, 2.96, 'Middle East', 7485600], | ||
| ['RUS', 68.6, 1.54, 'Europe', 141850000], | ||
| ['USA', 78.09, 2.05, 'North America', 307007000]]; | ||
| public scatter_ChartData = [ | ||
| ['Date', 'Sales Percentage'], | ||
| [new Date(2016, 3, 22), 78], | ||
| [new Date(2016, 3, 21,9,30,2),88], | ||
| [new Date(2016, 3, 20), 67], | ||
| [new Date(2016, 3, 19,8,34,7), 98], | ||
| [new Date(2016, 3, 18,15,34,7),95], | ||
| [new Date(2016, 3, 16,7,30,45),89], | ||
| [new Date(2016, 3, 16,15,40,35),68] | ||
| ]; | ||
| public candle_ChartData = [ | ||
| ['Day','Low','Opening value','Closing value','High'], | ||
| ['Mon', 28, 28, 38, 38], | ||
| ['Tue', 38, 38, 55, 55], | ||
| ['Wed', 55, 55, 77, 77], | ||
| ['Thu', 77, 77, 66, 66], | ||
| ['Fri', 66, 66, 22, 22] | ||
| ]; | ||
| public line_ChartData = [ | ||
| ['Year', 'Sales', 'Expenses'], | ||
| ['2004', 1000, 400], | ||
| ['2005', 1170, 460], | ||
| ['2006', 660, 1120], | ||
| ['2007', 1030, 540]]; | ||
| public bubble_ChartData = [ | ||
| ['ID', 'Life Expectancy', 'Fertility Rate', 'Region', 'Population'], | ||
| ['CAN', 80.66, 1.67, 'North America', 33739900], | ||
| ['DEU', 79.84, 1.36, 'Europe', 81902307], | ||
| ['DNK', 78.6, 1.84, 'Europe', 5523095], | ||
| ['EGY', 72.73, 2.78, 'Middle East', 79716203], | ||
| ['GBR', 80.05, 2, 'Europe', 61801570], | ||
| ['IRN', 72.49, 1.7, 'Middle East', 73137148], | ||
| ['IRQ', 68.09, 4.77, 'Middle East', 31090763], | ||
| ['ISR', 81.55, 2.96, 'Middle East', 7485600], | ||
| ['RUS', 68.6, 1.54, 'Europe', 141850000], | ||
| ['USA', 78.09, 2.05, 'North America', 307007000]]; | ||
| public scatter_ChartData = [ | ||
| ['Date', 'Sales Percentage'], | ||
| [new Date(2016, 3, 22), 78], | ||
| [new Date(2016, 3, 21, 9, 30, 2), 88], | ||
| [new Date(2016, 3, 20), 67], | ||
| [new Date(2016, 3, 19, 8, 34, 7), 98], | ||
| [new Date(2016, 3, 18, 15, 34, 7), 95], | ||
| [new Date(2016, 3, 16, 7, 30, 45), 89], | ||
| [new Date(2016, 3, 16, 15, 40, 35), 68] | ||
| ]; | ||
| public candle_ChartData = [ | ||
| ['Day', 'Low', 'Opening value', 'Closing value', 'High'], | ||
| ['Mon', 28, 28, 38, 38], | ||
| ['Tue', 38, 38, 55, 55], | ||
| ['Wed', 55, 55, 77, 77], | ||
| ['Thu', 77, 77, 66, 66], | ||
| ['Fri', 66, 66, 22, 22] | ||
| ]; | ||
| public pie_ChartData = [ | ||
| ['Task', 'Hours per Day'], | ||
| ['Work', 11], | ||
| ['Eat', 2], | ||
| ['Commute', 2], | ||
| ['Watch TV', 2], | ||
| ['Sleep', 7] ]; | ||
| ['Task', 'Hours per Day'], | ||
| ['Work', 11], | ||
| ['Eat', 2], | ||
| ['Commute', 2], | ||
| ['Watch TV', 2], | ||
| ['Sleep', 7]]; | ||
| public bar_ChartData = [ | ||
| ['City', '2010 Population', '2000 Population'], | ||
| ['New York City, NY', 8175000, 8008000], | ||
| ['Los Angeles, CA', 3792000, 3694000], | ||
| ['Chicago, IL', 2695000, 2896000], | ||
| ['Houston, TX', 2099000, 1953000], | ||
| ['Philadelphia, PA', 1526000, 1517000]]; | ||
| ['City', '2010 Population', '2000 Population'], | ||
| ['New York City, NY', 8175000, 8008000], | ||
| ['Los Angeles, CA', 3792000, 3694000], | ||
| ['Chicago, IL', 2695000, 2896000], | ||
| ['Houston, TX', 2099000, 1953000], | ||
| ['Philadelphia, PA', 1526000, 1517000]]; | ||
| public map_ChartData = [ | ||
| ['Country', 'Popularity'], | ||
| ['Germany', 200], | ||
| ['United States', 300], | ||
| ['Brazil', 400], | ||
| ['Canada', 500], | ||
| ['France', 600], | ||
| ['RU', 700] | ||
| ]; | ||
| public line_ChartOptions = { | ||
| title: 'Company Performance', | ||
| curveType: 'function', | ||
| legend: { position: 'bottom' | ||
| } | ||
| title: 'Company Performance', | ||
| curveType: 'function', | ||
| legend: { | ||
| position: 'bottom' | ||
| } | ||
| }; | ||
| public bubble_ChartOptions= { | ||
| title: 'Correlation between life expectancy, fertility rate ' + | ||
| 'and population of some world countries (2010)', | ||
| hAxis: {title: 'Life Expectancy'}, | ||
| vAxis: {title: 'Fertility Rate'}, | ||
| bubble: {textStyle: {fontSize: 11}} | ||
| public bubble_ChartOptions = { | ||
| title: 'Correlation between life expectancy, fertility rate ' + | ||
| 'and population of some world countries (2010)', | ||
| hAxis: { title: 'Life Expectancy' }, | ||
| vAxis: { title: 'Fertility Rate' }, | ||
| bubble: { textStyle: { fontSize: 11 } } | ||
| }; | ||
| public candle_ChartOptions = { | ||
| legend: 'none', | ||
| bar: { groupWidth: '100%' }, // Remove space between bars. | ||
| candlestick: { | ||
| fallingColor: { strokeWidth: 0, fill: '#a52714' }, // red | ||
| risingColor: { strokeWidth: 0, fill: '#0f9d58' } // green | ||
| } | ||
| legend: 'none', | ||
| bar: { groupWidth: '100%' }, // Remove space between bars. | ||
| candlestick: { | ||
| fallingColor: { strokeWidth: 0, fill: '#a52714' }, // red | ||
| risingColor: { strokeWidth: 0, fill: '#0f9d58' } // green | ||
| } | ||
| }; | ||
| public scatter_ChartOptions = { | ||
| legend: { position: 'bottom' | ||
| }, | ||
| legend: { | ||
| position: 'bottom' | ||
| }, | ||
| title: 'Company Sales Percentage' | ||
| }; | ||
| public bar_ChartOptions = { | ||
| title: 'Population of Largest U.S. Cities', | ||
| chartArea: {width: '50%'}, | ||
| hAxis: { | ||
| title: 'Total Population', | ||
| minValue: 0, | ||
| textStyle: { | ||
| bold: true, | ||
| fontSize: 12, | ||
| color: '#4d4d4d' | ||
| }, | ||
| titleTextStyle: { | ||
| bold: true, | ||
| fontSize: 18, | ||
| color: '#4d4d4d' | ||
| } | ||
| }, | ||
| vAxis: { | ||
| title: 'City', | ||
| textStyle: { | ||
| fontSize: 14, | ||
| bold: true, | ||
| color: '#848484' | ||
| }, | ||
| titleTextStyle: { | ||
| fontSize: 14, | ||
| bold: true, | ||
| color: '#848484' | ||
| } | ||
| } | ||
| }; | ||
| public pie_ChartOptions = { | ||
| title: 'My Daily Activities', | ||
| width: 900, | ||
| height: 500 | ||
| title: 'Population of Largest U.S. Cities', | ||
| chartArea: { width: '50%' }, | ||
| hAxis: { | ||
| title: 'Total Population', | ||
| minValue: 0, | ||
| textStyle: { | ||
| bold: true, | ||
| fontSize: 12, | ||
| color: '#4d4d4d' | ||
| }, | ||
| titleTextStyle: { | ||
| bold: true, | ||
| fontSize: 18, | ||
| color: '#4d4d4d' | ||
| } | ||
| }, | ||
| vAxis: { | ||
| title: 'City', | ||
| textStyle: { | ||
| fontSize: 14, | ||
| bold: true, | ||
| color: '#848484' | ||
| }, | ||
| titleTextStyle: { | ||
| fontSize: 14, | ||
| bold: true, | ||
| color: '#848484' | ||
| } | ||
| } | ||
| }; | ||
| public pie_ChartOptions = { | ||
| title: 'My Daily Activities', | ||
| width: 900, | ||
| height: 500 | ||
| }; | ||
| public gauge_ChartData = [ | ||
| ['Label', 'Value'], | ||
| ['Systolic', 120], | ||
| ['Diastolic', 80] ]; | ||
| ['Label', 'Value'], | ||
| ['Systolic', 120], | ||
| ['Diastolic', 80]]; | ||
| public gauge_ChartOptions = { | ||
| width: 400, height: 120, | ||
| redFrom: 90, redTo: 100, | ||
| yellowFrom:75, yellowTo: 90, | ||
| minorTicks: 5 | ||
| }; | ||
| width: 400, height: 120, | ||
| redFrom: 90, redTo: 100, | ||
| yellowFrom: 75, yellowTo: 90, | ||
| minorTicks: 5 | ||
| }; | ||
| public area_ChartData = [ | ||
| ['Year', 'Sales', 'Expenses'], | ||
| ['2013', 1000, 400], | ||
| ['2014', 1170, 460], | ||
| ['2015', 660, 1120], | ||
| ['2016', 1030, 540] | ||
| ]; | ||
| ['Year', 'Sales', 'Expenses'], | ||
| ['2013', 1000, 400], | ||
| ['2014', 1170, 460], | ||
| ['2015', 660, 1120], | ||
| ['2016', 1030, 540] | ||
| ]; | ||
| public area_ChartOptions = { | ||
| title: 'Company Performance', | ||
| hAxis: {title: 'Year', titleTextStyle: {color: '#333'}}, | ||
| vAxis: {minValue: 0} | ||
| title: 'Company Performance', | ||
| hAxis: { title: 'Year', titleTextStyle: { color: '#333' } }, | ||
| vAxis: { minValue: 0 } | ||
| }; | ||
| public map_ChartOptions = {}; | ||
| } |
| { | ||
| "name": "angular2-google-chart", | ||
| "version": "1.1.3", | ||
| "version": "1.1.4", | ||
| "description": "google chart directive for angular2", | ||
@@ -5,0 +5,0 @@ "main": "index.js", |
358
README.md
@@ -1,149 +0,215 @@ | ||
| Angular2 | ||
| ========= | ||
| # Angular2 | ||
| The sources for this package are in (https://github.com/vimalavinisha/angular2-google-chart) repo. Please file issues and pull requests against this repo. | ||
| The sources for this package are in (<https://github.com/vimalavinisha/angular2-google-chart>) repo. Please file issues and pull requests against this repo. | ||
| ## Demo Output | ||
|  | ||
| ##Usage | ||
| node install | ||
| npm install angular2-google-chart | ||
| bower install | ||
| bower install google-chart | ||
| ###1.In index.html page include following script | ||
| <script src="https://www.gstatic.com/charts/loader.js"></script> | ||
| <script> | ||
| !important: You want to give this variable(var googleLoaded = false;). This is used to run multiple chart in your jade. | ||
| var googleLoaded = false; | ||
| </script> | ||
| ###2.component file use like below | ||
| import {Component} from '@angular/core'; | ||
| import {GoogleChart} from './directives/angular2-google-chart.directive'; | ||
| @Component({ | ||
| selector : 'my-app', | ||
| directives: [GoogleChart], | ||
| template: ` | ||
| <div id="line_chart",[chartData]="line_ChartData", [chartOptions] = "line_ChartOptions",chartType="LineChart",GoogleChart/> | ||
| <div id="bubble_chart",[chartData]="bubble_ChartData", [chartOptions] = "bubble_ChartOptions",chartType="BubbleChart",GoogleChart/> | ||
| <div id="scatter_chart",[chartData]="scatter_ChartData", [chartOptions] = "scatter_ChartOptions",chartType="ScatterChart",GoogleChart/> | ||
| <div id="candle_chart",[chartData]="candle_ChartData", [chartOptions] = "candle_ChartOptions",chartType="CandlestickChart",GoogleChart/> | ||
| <div id="pie_chart",[chartData]="pie_ChartData", [chartOptions] = "pie_ChartOptions",chartType="PieChart",GoogleChart/> | ||
| <div id="bar_chart",[chartData]="bar_ChartData", [chartOptions] = "bar_ChartOptions",chartType="BarChart",GoogleChart/>` | ||
| }) | ||
| export class AppComponent { | ||
| public line_ChartData = [ | ||
| ['Year', 'Sales', 'Expenses'], | ||
| ['2004', 1000, 400], | ||
| ['2005', 1170, 460], | ||
| ['2006', 660, 1120], | ||
| ['2007', 1030, 540]]; | ||
| public bubble_ChartData = [ | ||
| ['ID', 'Life Expectancy', 'Fertility Rate', 'Region', 'Population'], | ||
| ['CAN', 80.66, 1.67, 'North America', 33739900], | ||
| ['DEU', 79.84, 1.36, 'Europe', 81902307], | ||
| ['DNK', 78.6, 1.84, 'Europe', 5523095], | ||
| ['EGY', 72.73, 2.78, 'Middle East', 79716203], | ||
| ['GBR', 80.05, 2, 'Europe', 61801570], | ||
| ['IRN', 72.49, 1.7, 'Middle East', 73137148], | ||
| ['IRQ', 68.09, 4.77, 'Middle East', 31090763], | ||
| ['ISR', 81.55, 2.96, 'Middle East', 7485600], | ||
| ['RUS', 68.6, 1.54, 'Europe', 141850000], | ||
| ['USA', 78.09, 2.05, 'North America', 307007000]]; | ||
| public scatter_ChartData = [ | ||
| ['Date', 'Sales Percentage'], | ||
| [new Date(2016, 3, 22), 78], | ||
| [new Date(2016, 3, 21,9,30,2),88], | ||
| [new Date(2016, 3, 20), 67], | ||
| [new Date(2016, 3, 19,8,34,7), 98], | ||
| [new Date(2016, 3, 18,15,34,7),95], | ||
| [new Date(2016, 3, 16,7,30,45),89], | ||
| [new Date(2016, 3, 16,15,40,35),68] | ||
| ]; | ||
| public candle_ChartData = [ | ||
| ['Day','Low','Opening value','Closing value','High'], | ||
| ['Mon', 28, 28, 38, 38], | ||
| ['Tue', 38, 38, 55, 55], | ||
| ['Wed', 55, 55, 77, 77], | ||
| ['Thu', 77, 77, 66, 66], | ||
| ['Fri', 66, 66, 22, 22] | ||
| ]; | ||
| public pie_ChartData = [ | ||
| ['Task', 'Hours per Day'], | ||
| ['Work', 11], | ||
| ['Eat', 2], | ||
| ['Commute', 2], | ||
| ['Watch TV', 2], | ||
| ['Sleep', 7] ]; | ||
| public bar_ChartData = [ | ||
| ['City', '2010 Population', '2000 Population'], | ||
| ['New York City, NY', 8175000, 8008000], | ||
| ['Los Angeles, CA', 3792000, 3694000], | ||
| ['Chicago, IL', 2695000, 2896000], | ||
| ['Houston, TX', 2099000, 1953000], | ||
| ['Philadelphia, PA', 1526000, 1517000]]; | ||
| public line_ChartOptions = { | ||
| title: 'Company Performance', | ||
| curveType: 'function', | ||
| legend: { position: 'bottom' | ||
| } | ||
| }; | ||
| public bubble_ChartOptions= { | ||
| title: 'Correlation between life expectancy, fertility rate ' + | ||
| 'and population of some world countries (2010)', | ||
| hAxis: {title: 'Life Expectancy'}, | ||
| vAxis: {title: 'Fertility Rate'}, | ||
| bubble: {textStyle: {fontSize: 11}} | ||
| }; | ||
| public candle_ChartOptions = { | ||
| legend: 'none', | ||
| bar: { groupWidth: '100%' }, // Remove space between bars. | ||
| candlestick: { | ||
| fallingColor: { strokeWidth: 0, fill: '#a52714' }, // red | ||
| risingColor: { strokeWidth: 0, fill: '#0f9d58' } // green | ||
| } | ||
| }; | ||
| public scatter_ChartOptions = { | ||
| legend: { position: 'bottom' | ||
| } | ||
| title: 'Company Sales Percentage', | ||
| }; | ||
| public bar_ChartOptions = { | ||
| title: 'Population of Largest U.S. Cities', | ||
| chartArea: {width: '50%'}, | ||
| hAxis: { | ||
| title: 'Total Population', | ||
| minValue: 0, | ||
| textStyle: { | ||
| bold: true, | ||
| fontSize: 12, | ||
| color: '#4d4d4d' | ||
| }, | ||
| titleTextStyle: { | ||
| bold: true, | ||
| fontSize: 18, | ||
| color: '#4d4d4d' | ||
| } | ||
| }, | ||
| vAxis: { | ||
| title: 'City', | ||
| textStyle: { | ||
| fontSize: 14, | ||
| bold: true, | ||
| color: '#848484' | ||
| }, | ||
| titleTextStyle: { | ||
| fontSize: 14, | ||
| bold: true, | ||
| color: '#848484' | ||
| } | ||
| } | ||
| }; | ||
| public pie_ChartOptions = { | ||
| title: 'My Daily Activities' | ||
| width: 900, | ||
| height: 500 | ||
| }; | ||
| } | ||
| ###3 Example Charts | ||
| <img src="../app/assets/images/google-charts-output.png"> | ||
| 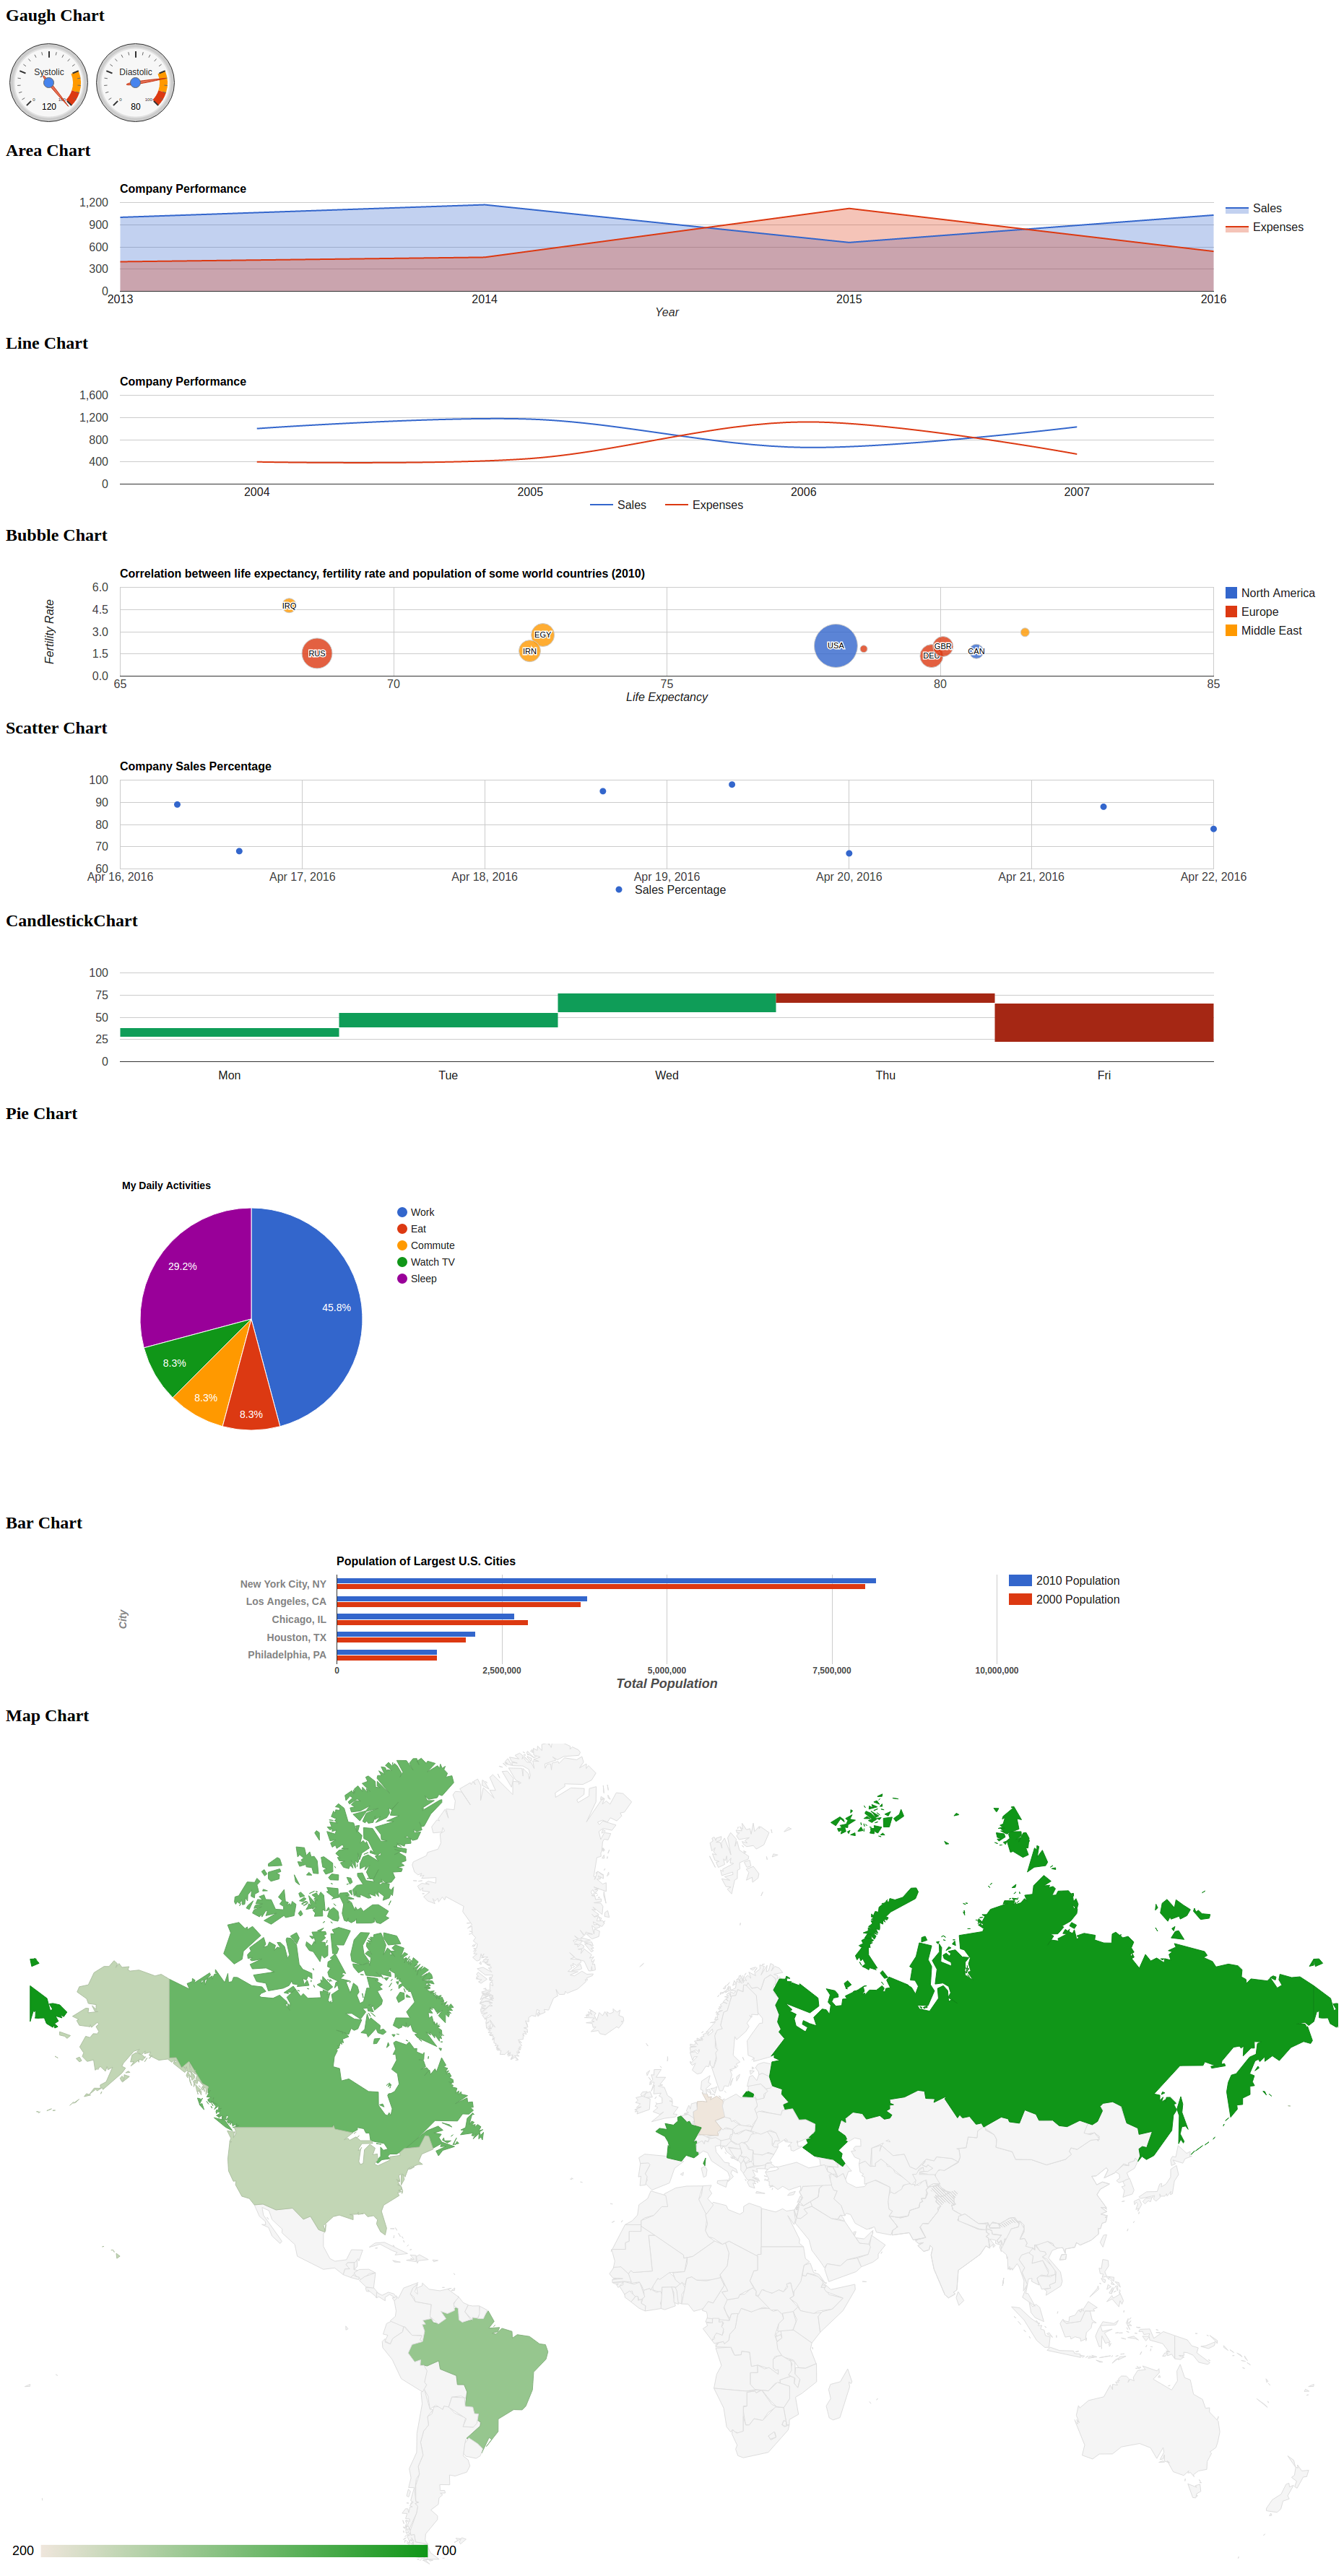 | ||
| ## Usage | ||
| ``` | ||
| node install | ||
| npm install angular2-google-chart | ||
| bower install | ||
| bower install google-chart | ||
| ``` | ||
| ### 1.In index.html page include following script | ||
| ``` | ||
| <script src="https://www.gstatic.com/charts/loader.js"></script> | ||
| <script> | ||
| // !important: You want to give this variable(var googleLoaded = false;). This is used to run multiple chart in your jade. | ||
| var googleLoaded = false; | ||
| // !important: Define which chart packages to preload.Because this package uses ChartWrappers you can use any chart type that Google supports, but if it // isn't loaded it will load it on demand. | ||
| var googleChartsPackagesToLoad = ['geochart']; | ||
| </script> | ||
| ``` | ||
| ### 2.component file use like below | ||
| ``` | ||
| import {Component} from '@angular/core'; | ||
| @Component({ | ||
| selector: 'my-app', | ||
| template: ` | ||
| <h2> Gaugh Chart</h2> | ||
| <div id="gauge_chart" [chartData]="gauge_ChartData" [chartOptions]= "gauge_ChartOptions" chartType="Gauge" GoogleChart></div> | ||
| <h2> Area Chart</h2> | ||
| <div id="area_chart" [chartData]="area_ChartData" [chartOptions]= "area_ChartOptions" chartType="AreaChart" GoogleChart></div> | ||
| <h2> Line Chart</h2> | ||
| <div id="line_chart" [chartData]="line_ChartData" [chartOptions]= "line_ChartOptions" chartType="LineChart" GoogleChart></div> | ||
| <h2> Bubble Chart</h2> | ||
| <div id="bubble_chart" [chartData]="bubble_ChartData" [chartOptions] = "bubble_ChartOptions" chartType="BubbleChart" GoogleChart></div> | ||
| <h2> Scatter Chart</h2> | ||
| <div id="scatter_chart" [chartData]="scatter_ChartData" [chartOptions] = "scatter_ChartOptions" chartType="ScatterChart" GoogleChart></div> | ||
| <h2> CandlestickChart</h2> | ||
| <div id="candle_chart" [chartData]="candle_ChartData" [chartOptions] = "candle_ChartOptions" chartType="CandlestickChart" GoogleChart></div> | ||
| <h2> Pie Chart</h2> | ||
| <div id="pie_chart" [chartData]="pie_ChartData" [chartOptions] = "pie_ChartOptions" chartType="PieChart" GoogleChart></div> | ||
| <h2> Bar Chart</h2> | ||
| <div id="bar_chart" [chartData]="bar_ChartData" [chartOptions] = "bar_ChartOptions" chartType="BarChart" GoogleChart></div> | ||
| <h2> Map Chart</h2> | ||
| <div id="map_chart" [chartData]="map_ChartData" [chartOptions] = "map_ChartOptions" chartType="GeoChart" GoogleChart></div> | ||
| ` | ||
| }) | ||
| export class AppComponent { | ||
| public line_ChartData = [ | ||
| ['Year', 'Sales', 'Expenses'], | ||
| ['2004', 1000, 400], | ||
| ['2005', 1170, 460], | ||
| ['2006', 660, 1120], | ||
| ['2007', 1030, 540]]; | ||
| public bubble_ChartData = [ | ||
| ['ID', 'Life Expectancy', 'Fertility Rate', 'Region', 'Population'], | ||
| ['CAN', 80.66, 1.67, 'North America', 33739900], | ||
| ['DEU', 79.84, 1.36, 'Europe', 81902307], | ||
| ['DNK', 78.6, 1.84, 'Europe', 5523095], | ||
| ['EGY', 72.73, 2.78, 'Middle East', 79716203], | ||
| ['GBR', 80.05, 2, 'Europe', 61801570], | ||
| ['IRN', 72.49, 1.7, 'Middle East', 73137148], | ||
| ['IRQ', 68.09, 4.77, 'Middle East', 31090763], | ||
| ['ISR', 81.55, 2.96, 'Middle East', 7485600], | ||
| ['RUS', 68.6, 1.54, 'Europe', 141850000], | ||
| ['USA', 78.09, 2.05, 'North America', 307007000]]; | ||
| public scatter_ChartData = [ | ||
| ['Date', 'Sales Percentage'], | ||
| [new Date(2016, 3, 22), 78], | ||
| [new Date(2016, 3, 21, 9, 30, 2), 88], | ||
| [new Date(2016, 3, 20), 67], | ||
| [new Date(2016, 3, 19, 8, 34, 7), 98], | ||
| [new Date(2016, 3, 18, 15, 34, 7), 95], | ||
| [new Date(2016, 3, 16, 7, 30, 45), 89], | ||
| [new Date(2016, 3, 16, 15, 40, 35), 68] | ||
| ]; | ||
| public candle_ChartData = [ | ||
| ['Day', 'Low', 'Opening value', 'Closing value', 'High'], | ||
| ['Mon', 28, 28, 38, 38], | ||
| ['Tue', 38, 38, 55, 55], | ||
| ['Wed', 55, 55, 77, 77], | ||
| ['Thu', 77, 77, 66, 66], | ||
| ['Fri', 66, 66, 22, 22] | ||
| ]; | ||
| public pie_ChartData = [ | ||
| ['Task', 'Hours per Day'], | ||
| ['Work', 11], | ||
| ['Eat', 2], | ||
| ['Commute', 2], | ||
| ['Watch TV', 2], | ||
| ['Sleep', 7]]; | ||
| public bar_ChartData = [ | ||
| ['City', '2010 Population', '2000 Population'], | ||
| ['New York City, NY', 8175000, 8008000], | ||
| ['Los Angeles, CA', 3792000, 3694000], | ||
| ['Chicago, IL', 2695000, 2896000], | ||
| ['Houston, TX', 2099000, 1953000], | ||
| ['Philadelphia, PA', 1526000, 1517000]]; | ||
| public map_ChartData = [ | ||
| ['Country', 'Popularity'], | ||
| ['Germany', 200], | ||
| ['United States', 300], | ||
| ['Brazil', 400], | ||
| ['Canada', 500], | ||
| ['France', 600], | ||
| ['RU', 700] | ||
| ]; | ||
| public line_ChartOptions = { | ||
| title: 'Company Performance', | ||
| curveType: 'function', | ||
| legend: { | ||
| position: 'bottom' | ||
| } | ||
| }; | ||
| public bubble_ChartOptions = { | ||
| title: 'Correlation between life expectancy, fertility rate ' + | ||
| 'and population of some world countries (2010)', | ||
| hAxis: { title: 'Life Expectancy' }, | ||
| vAxis: { title: 'Fertility Rate' }, | ||
| bubble: { textStyle: { fontSize: 11 } } | ||
| }; | ||
| public candle_ChartOptions = { | ||
| legend: 'none', | ||
| bar: { groupWidth: '100%' }, // Remove space between bars. | ||
| candlestick: { | ||
| fallingColor: { strokeWidth: 0, fill: '#a52714' }, // red | ||
| risingColor: { strokeWidth: 0, fill: '#0f9d58' } // green | ||
| } | ||
| }; | ||
| public scatter_ChartOptions = { | ||
| legend: { | ||
| position: 'bottom' | ||
| }, | ||
| title: 'Company Sales Percentage' | ||
| }; | ||
| public bar_ChartOptions = { | ||
| title: 'Population of Largest U.S. Cities', | ||
| chartArea: { width: '50%' }, | ||
| hAxis: { | ||
| title: 'Total Population', | ||
| minValue: 0, | ||
| textStyle: { | ||
| bold: true, | ||
| fontSize: 12, | ||
| color: '#4d4d4d' | ||
| }, | ||
| titleTextStyle: { | ||
| bold: true, | ||
| fontSize: 18, | ||
| color: '#4d4d4d' | ||
| } | ||
| }, | ||
| vAxis: { | ||
| title: 'City', | ||
| textStyle: { | ||
| fontSize: 14, | ||
| bold: true, | ||
| color: '#848484' | ||
| }, | ||
| titleTextStyle: { | ||
| fontSize: 14, | ||
| bold: true, | ||
| color: '#848484' | ||
| } | ||
| } | ||
| }; | ||
| public pie_ChartOptions = { | ||
| title: 'My Daily Activities', | ||
| width: 900, | ||
| height: 500 | ||
| }; | ||
| public gauge_ChartData = [ | ||
| ['Label', 'Value'], | ||
| ['Systolic', 120], | ||
| ['Diastolic', 80]]; | ||
| public gauge_ChartOptions = { | ||
| width: 400, height: 120, | ||
| redFrom: 90, redTo: 100, | ||
| yellowFrom: 75, yellowTo: 90, | ||
| minorTicks: 5 | ||
| }; | ||
| public area_ChartData = [ | ||
| ['Year', 'Sales', 'Expenses'], | ||
| ['2013', 1000, 400], | ||
| ['2014', 1170, 460], | ||
| ['2015', 660, 1120], | ||
| ['2016', 1030, 540] | ||
| ]; | ||
| public area_ChartOptions = { | ||
| title: 'Company Performance', | ||
| hAxis: { title: 'Year', titleTextStyle: { color: '#333' } }, | ||
| vAxis: { minValue: 0 } | ||
| }; | ||
| public map_ChartOptions = {}; | ||
| } | ||
| ``` | ||
| ### 3 Example Charts | ||
| ``` | ||
| <img src="../app/assets/images/google-charts-output.png"> | ||
| ``` |
Sorry, the diff of this file is not supported yet
Sorry, the diff of this file is not supported yet
Sorry, the diff of this file is not supported yet
Sorry, the diff of this file is not supported yet
New alerts
License Policy Violation
LicenseThis package is not allowed per your license policy. Review the package's license to ensure compliance.
Found 1 instance in 1 package
Fixed alerts
License Policy Violation
LicenseThis package is not allowed per your license policy. Review the package's license to ensure compliance.
Found 1 instance in 1 package
Improved metrics
- Total package byte prevSize
- increased by139.65%
808139
- Lines of code
- increased by1.01%
2607
- Number of lines in readme file
- increased by44%
216