Research
Security News
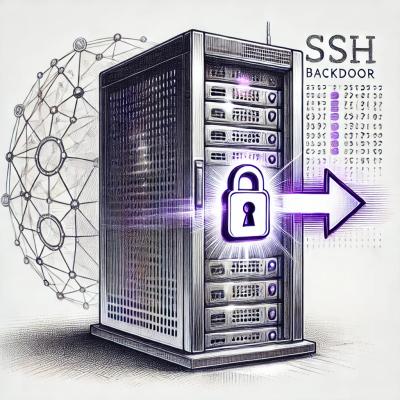
Malicious npm Packages Inject SSH Backdoors via Typosquatted Libraries
Socket’s threat research team has detected six malicious npm packages typosquatting popular libraries to insert SSH backdoors.
[](https://circleci.com/gh/ConsenSys/armlet) [](https://coveralls.io/github/ConsenSys/armlet?b
Armlet is a thin wrapper around the MythX API written in Javascript. It simplifies interaction with MythX. For example, the library wraps API analysis requests into a promise, merges status information with analysis-result information, and judiciously polls for results.
A simple command-line tool, mythx-analysis, is provided to show how to use the API.
It can be used to run MythX analyses on a single Solidity smart-contract text file.",
To install the latest stable version from NPM:
$ npm -g install armlet
If you're feeling adventurous, you can also install the from the master branch:
$ npm install -g git+https://git@github.com/ConsenSys/armlet.git
The -g or --global option above may not be needed depending on how
you work. It my ensuring mythx-analysis is in your path where it might not
otherwise be there.
Here is a small example of how you might use this client. For demonstration purposes, we’ll set the credentials created on the MythX, you can use either the Ethereum address or email used during registration and the password you created:
$ export MYTHX_PASSWORD='AAAyyyyyyyy@*#!?'
$ export MYTHX_ETH_ADDRESS=0xdeadbeefdeadbeefdeadbeefdeadbeefdeadbeefdeadbeef
Then get the MythX analysis results with the promise returned by the exposed function:
const armlet = require('armlet')
const client = new armlet.Client(
  {
      password: process.env.MYTHX_PASSWORD,
      ethAddress: process.env.MYTHX_ETH_ADDRESS,
  })

const data = {
    "bytecode": "0x608060405234801561001057600080fd5b5060d48061001f6000396000f3fe608060405260043610603f576000357c0100000000000000000000000000000000000000000000000000000000900463ffffffff16806338d94193146044575b600080fd5b348015604f57600080fd5b50607960048036036020811015606457600080fd5b8101908080359060200190929190505050608f565b6040518082815260200191505060405180910390f35b600081600881101515609d57fe5b01600091509050548156fea165627a7a723058206f554b09240c9771a583534d72575fcfb4623ab4df3ddc139442047795fd383b0029",
};

client.analyzeWithStatus(
    {
	"data": data,    // required
	"timeout": 2 * 60 * 1000,  // optional, but can improve response time
	"debug": false,            // optional: set to true if you want to see what's going on
    })
    .then(result => {
	const util = require('util');
	console.log(`${util.inspect(result.status, {depth: null})}`);
	console.log(`${util.inspect(result.issues, {depth: null})}`);
  }).catch(err => {
    console.log(err)
  })
For statistical tracking you can tag the type of tool making the request using clientToolName.
For example, to log analysis request as a use of armlet-readme, run:
client.analyzeWithStatus(
    {
	"data": data,
	"clientToolName": "armlet-readme"
    })
  .then(result => {
    console.log(result.status, {depth: null})
    console.log(result.issues, {depth: null})
  }).catch(err => {
    console.log(err)
  })
There are two time parameters, given in milliseconds, that change how quickly a analysis result is reported back:
The initial delay is the minimum amount of time that this library waits before attempting its first status poll. Note however that if a request has been cached, then results come back immediately and no status polling is needed. (The server caches previous analysis runs; it takes into account the data passed to it, the analysis mode, and the back-end versions of components used to provide the analysis.)
The maximum delay is the maximum amount of time we will wait for an analysis to complete. Note, however, that if the processing has not finished when this timeout is reached, it may still be running on the server side. Therefore when a timeout occurs, you will get back a UUID which can subsequently be used to get status and results.
The closer these two parameters are to the actual time range that is needed by analysis, the faster the response will get reported back after completion on the server end. Below we explain
Until we have a websocket interface so the server can directly pass back results without any additional action required on the server side, your REST API requires the client to poll for status. We have seen that this polling can cause a lot of overhead, if not done judiciously. So, each request is allowed up to 10 status probes.
We have seen that no analysis request will finish in less than a certain period of time. Since the number of probe per analysis is limited, it doesn't make sense to probe before the fastest analysis-completion time.
The 10 status probes are done in geometrically increasing time intervals. The first interval is the shortest and the last interval is the longest. The response rate at the beginning is better than the response rate at the end, in terms of how much additional time it takes before the analysis completion is noticed.
However this progression is not fixed. Instead, it takes into account the maximum amount of time you are willing to wait for a result.
In other words, the shorter the short period of time you give for the maximum timeout, the shorter the geometric succession of the 10 probes allotted to an analysis request will be.
To make this clear, if you only want to wait a; maximum of two minutes, then the first delay will be 0.3 seconds, while the delay before last poll will be about half a minute. If on the other hand you want to wait up to 2 hours, then the first delay will be 9 seconds, and the last one will be about 15 minutes.
Good guessing of these two parameters reduces the unnecessary probe time while providing good response around the declared period of time around that was declared.
So, how can you guess decent values? We have reasonable defaults built in. But there are two factors that you can use to get better estimates.
The first is the kind of analysis mode used: a "quick" analysis will usually be under two minutes, while a "full" analysis will usually be under two hours.
When an analysis request finishes, we provide the amount of time used broken into two components: the amount of time spent in analysis, and the amount of time spent in queuing. The queuing time can vary depending on what else is going on when the analysis request was sent, so that's why it is separated out. In addition, the library provides its own elapsed time in the response.
If you are making an analysis within an IDE which saves reports of past runs, such as truffle or VSCode, the timings can be used for estimates.
FAQs
[](https://circleci.com/gh/ConsenSys/armlet) [](https://coveralls.io/github/ConsenSys/armlet?b
The npm package armlet receives a total of 190 weekly downloads. As such, armlet popularity was classified as not popular.
We found that armlet demonstrated a not healthy version release cadence and project activity because the last version was released a year ago. It has 5 open source maintainers collaborating on the project.
Did you know?

Socket for GitHub automatically highlights issues in each pull request and monitors the health of all your open source dependencies. Discover the contents of your packages and block harmful activity before you install or update your dependencies.

Research
Security News
Socket’s threat research team has detected six malicious npm packages typosquatting popular libraries to insert SSH backdoors.

Security News
MITRE's 2024 CWE Top 25 highlights critical software vulnerabilities like XSS, SQL Injection, and CSRF, reflecting shifts due to a refined ranking methodology.

Security News
In this segment of the Risky Business podcast, Feross Aboukhadijeh and Patrick Gray discuss the challenges of tracking malware discovered in open source softare.