Security News
Research
Data Theft Repackaged: A Case Study in Malicious Wrapper Packages on npm
The Socket Research Team breaks down a malicious wrapper package that uses obfuscation to harvest credentials and exfiltrate sensitive data.

Synopsis • Installation • Usage • Compatibility • Documentation • Contribute • Credits
Dragonfly is a lightweight CPython debugger designed with speed in mind. Contrary to more traditional debuggers, like pdb, Dragonfly does not rely heavily on tracing, allowing the target application to run at full speed in most cases. Occasionally, tracing might be required, so that the slowdown would be similar to that of pdb in the worst case.
This package can be installed from PyPI with
pip install --user dfly --upgrade
To debug a Python script or application, simply prefix the command with dfly.
The built-in breakpoint() is replaced with Dragonfly's own implementation, so
that you can set breakpoints in your code by simply adding breakpoint() where
needed. Alternatively, if you are not using the dfly command, you can simply
import dragonfly.bite before any calls to breakpoint to achieve the same
effect.
Dragonfly is still in an early stage of development, so it is not yet feature complete. However, it is already usable for the most common debugging tasks, with some initial support for multi-threading.
If you find this tool useful, please consider starring the repository and/or becoming a Sponsor to support the development.
Dragonfly is tested on Linux and macOS with Python 3.8-3.12.
The typical CPython debugger relies heavily, or even exclusively on tracing in their implementation. This technique is very powerful, but it has a few shortcomings:
high overhead - tracing is slow, and it can slow down the target application by a factor of 10 or more.
limited support for multithreading - supporting multithreading in a tracing-based debugger is difficult, especially in older versions of Python.
Some of these problems have been addressed in PEP 669. But whilst the cost of monitoring has been lowered, some impact still remains. Besides, PEP 669 is only available in Python 3.12 and later.
Dragonfly poses itself as a lightweight alternative to the traditional, and the PEP 669-based debuggers. At its core, Dragonfly uses bytecode transformation to implement traps. These can be injected where breakpoints are requested, and control is then passed to the prompt. When the targeted bytecode is already being executed, Dragonfly turns on tracing to ensure that any breakpoints can still be hit. In this case, the performance impact can be similar to that of tracing-based debuggers. However, this should normally be a transient situation, and the ammortised cost of debugging should be essentially negligible.
To make this clearer, let's look at a simple example. Consider the following code:
def fibonacci(n):
    if n < 2:
        return n
    return fibonacci(n - 1) + fibonacci(n - 2)


from time import monotonic as time

start = time()
fibonacci(30)
end = time()
print(end - start)
When we run this without any debuggers, the reported time is of the order of 0.1 seconds.
$ python3.12 -m tests.fib
0.11031840229406953
If we run this with pdb, without any breakpoints, the reported time is of the order of over 3 seconds:
$ python3.12 -m pdb -m tests.fib
> /tmp/fib.py(1)<module>()
-> def fibonacci(n):
(Pdb) r
3.2781156906858087
--Return--
> /tmp/fib.py(12)<module>()->None
-> print(end - start)
(Pdb)
However, if we run it through Dragonfly, again without any breakpoints set, the reported time is essentially the same as without any debugger:
$ dfly -r python -m fib
0.11001458810642362
Dragonfly can also be used to debug CPython at the bytecode level. When setting
trace-opcodes with set trace-opcodes 1, every stepping operation will be
performed at the bytecode level. The disassemble command can be used to
display the bytecode currently running, along with the values in the stack for
the current frame.
If you want to help with the development, then have a look at the open issues and have a look at the contributing guidelines before you open a pull request.
You can also contribute to the development by either becoming a Patron on Patreon, by buying me a coffee on BMC or by chipping in a few pennies on PayPal.Me.
Artwork by Antea a.k.a. Aisling.
FAQs
Lightweight CPython Debugger
We found that dfly demonstrated a healthy version release cadence and project activity because the last version was released less than a year ago. It has 1 open source maintainer collaborating on the project.
Did you know?

Socket for GitHub automatically highlights issues in each pull request and monitors the health of all your open source dependencies. Discover the contents of your packages and block harmful activity before you install or update your dependencies.

Security News
Research
The Socket Research Team breaks down a malicious wrapper package that uses obfuscation to harvest credentials and exfiltrate sensitive data.

Research
Security News
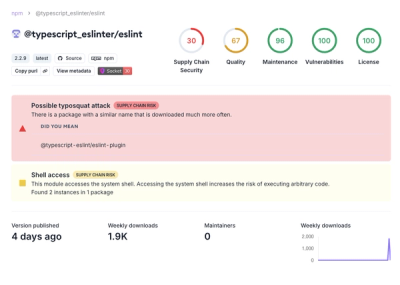
Attackers used a malicious npm package typosquatting a popular ESLint plugin to steal sensitive data, execute commands, and exploit developer systems.

Security News
The Ultralytics' PyPI Package was compromised four times in one weekend through GitHub Actions cache poisoning and failure to rotate previously compromised API tokens.