The purpose of the Extra Metrics project is to augment a standard v14 FileWave installation with additional metrics and dashboard capabilities.
Overview
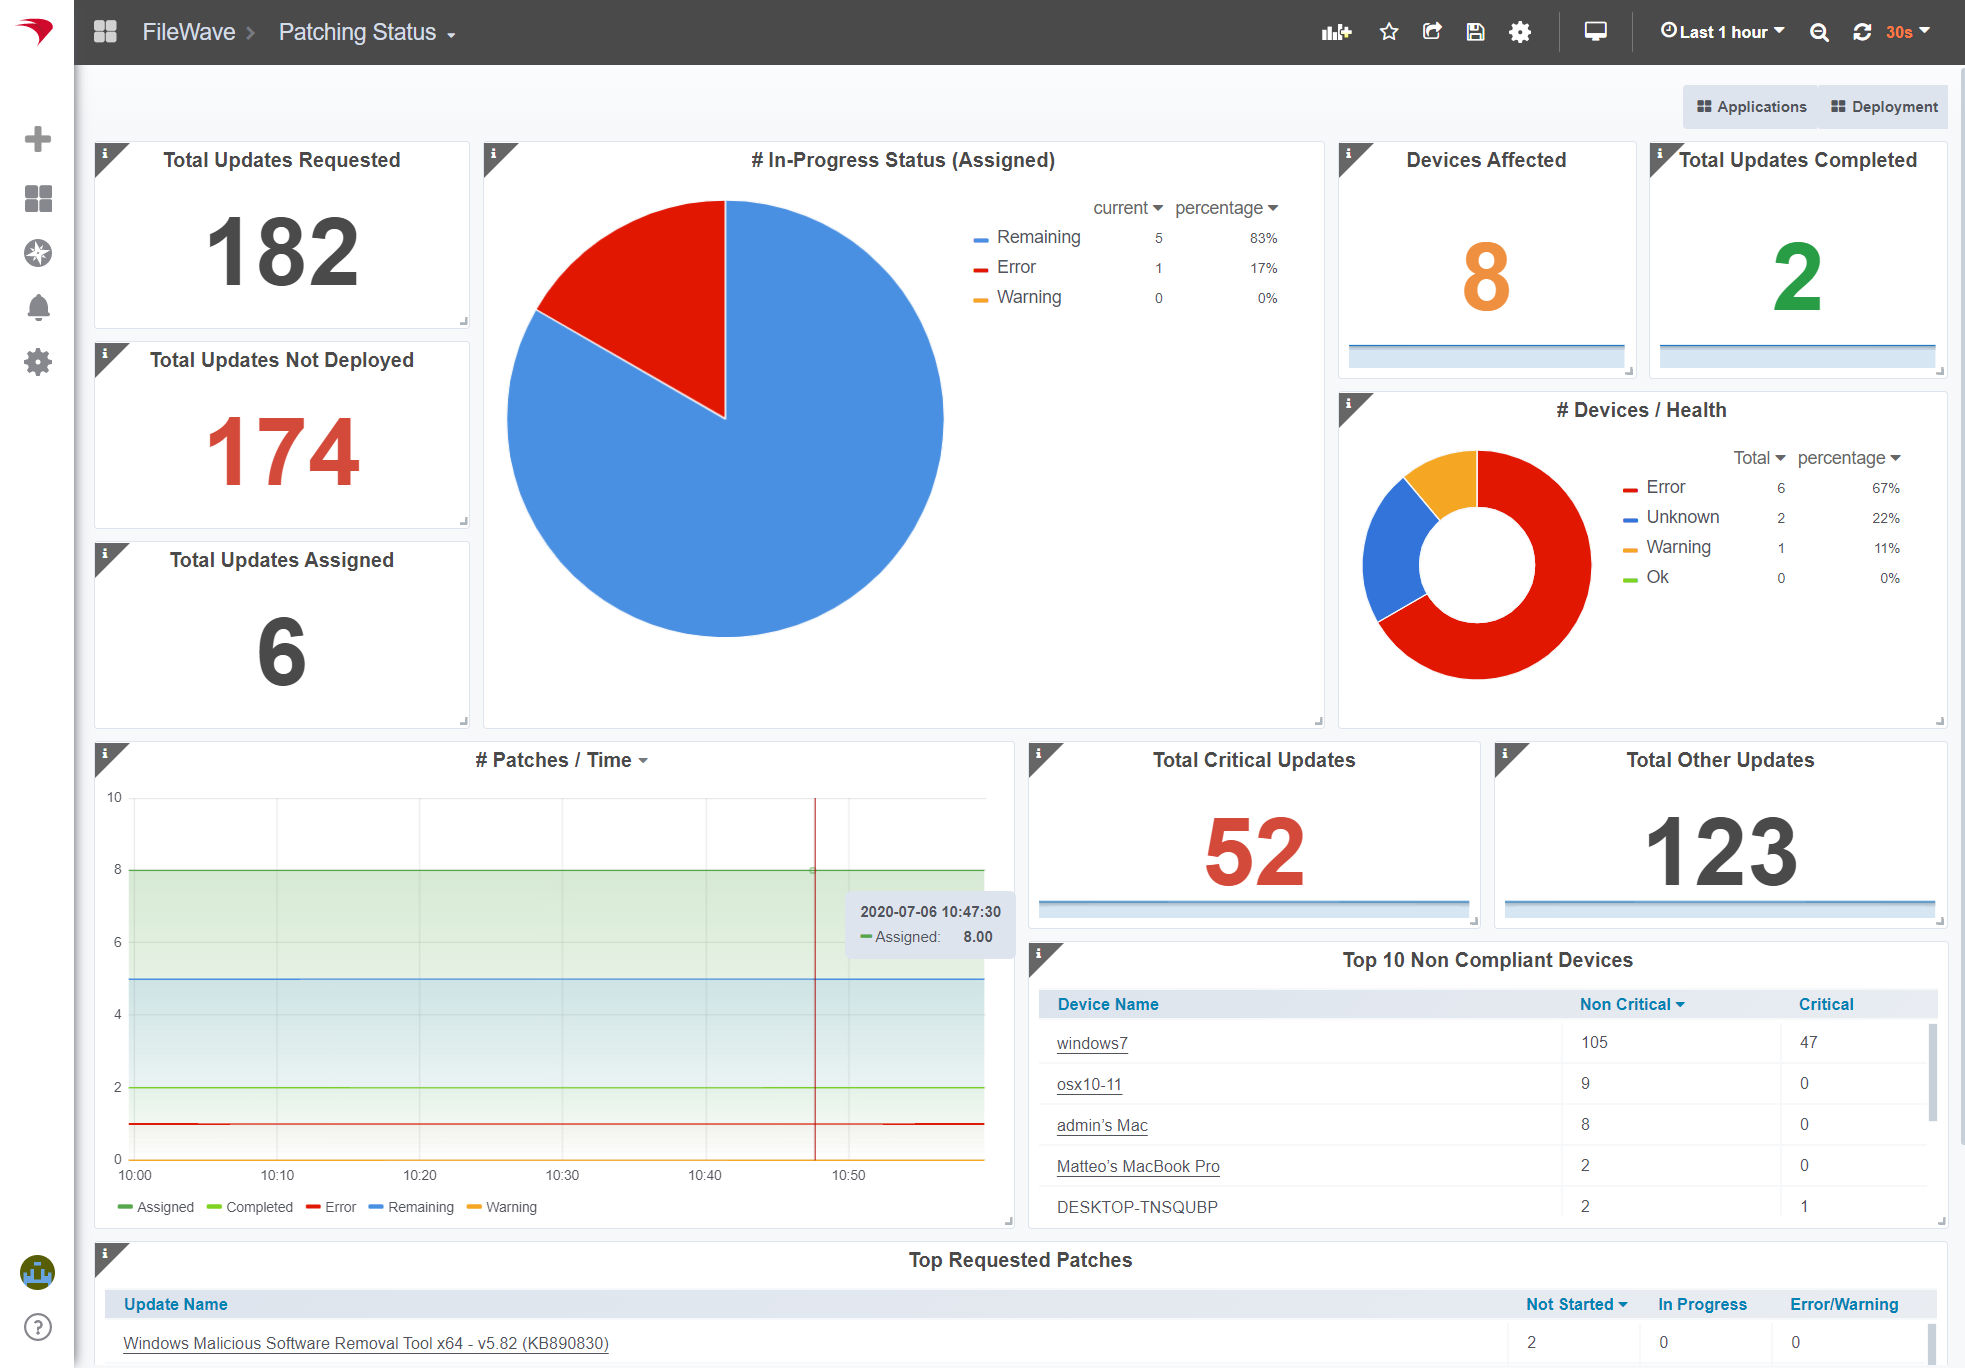
Extra Metrics provides a series of dashboards and prometheus metrics related to how your fleets deployments are progressing. The information can be used to show "at-a-glance" insights into the software patch status, device health and user specific deployments.
In as many cases as possible the Dashboard panels are linked into the FileWave Web, making it easy to "drill down" into more detail and take action.
Software Patch Status
What patches are available to be deployed? What is already being taken care of? How many devices are effected?
The software update (patch status) of clients is calculated using software update catalogs as well as information delivered by clients about the updates they require.

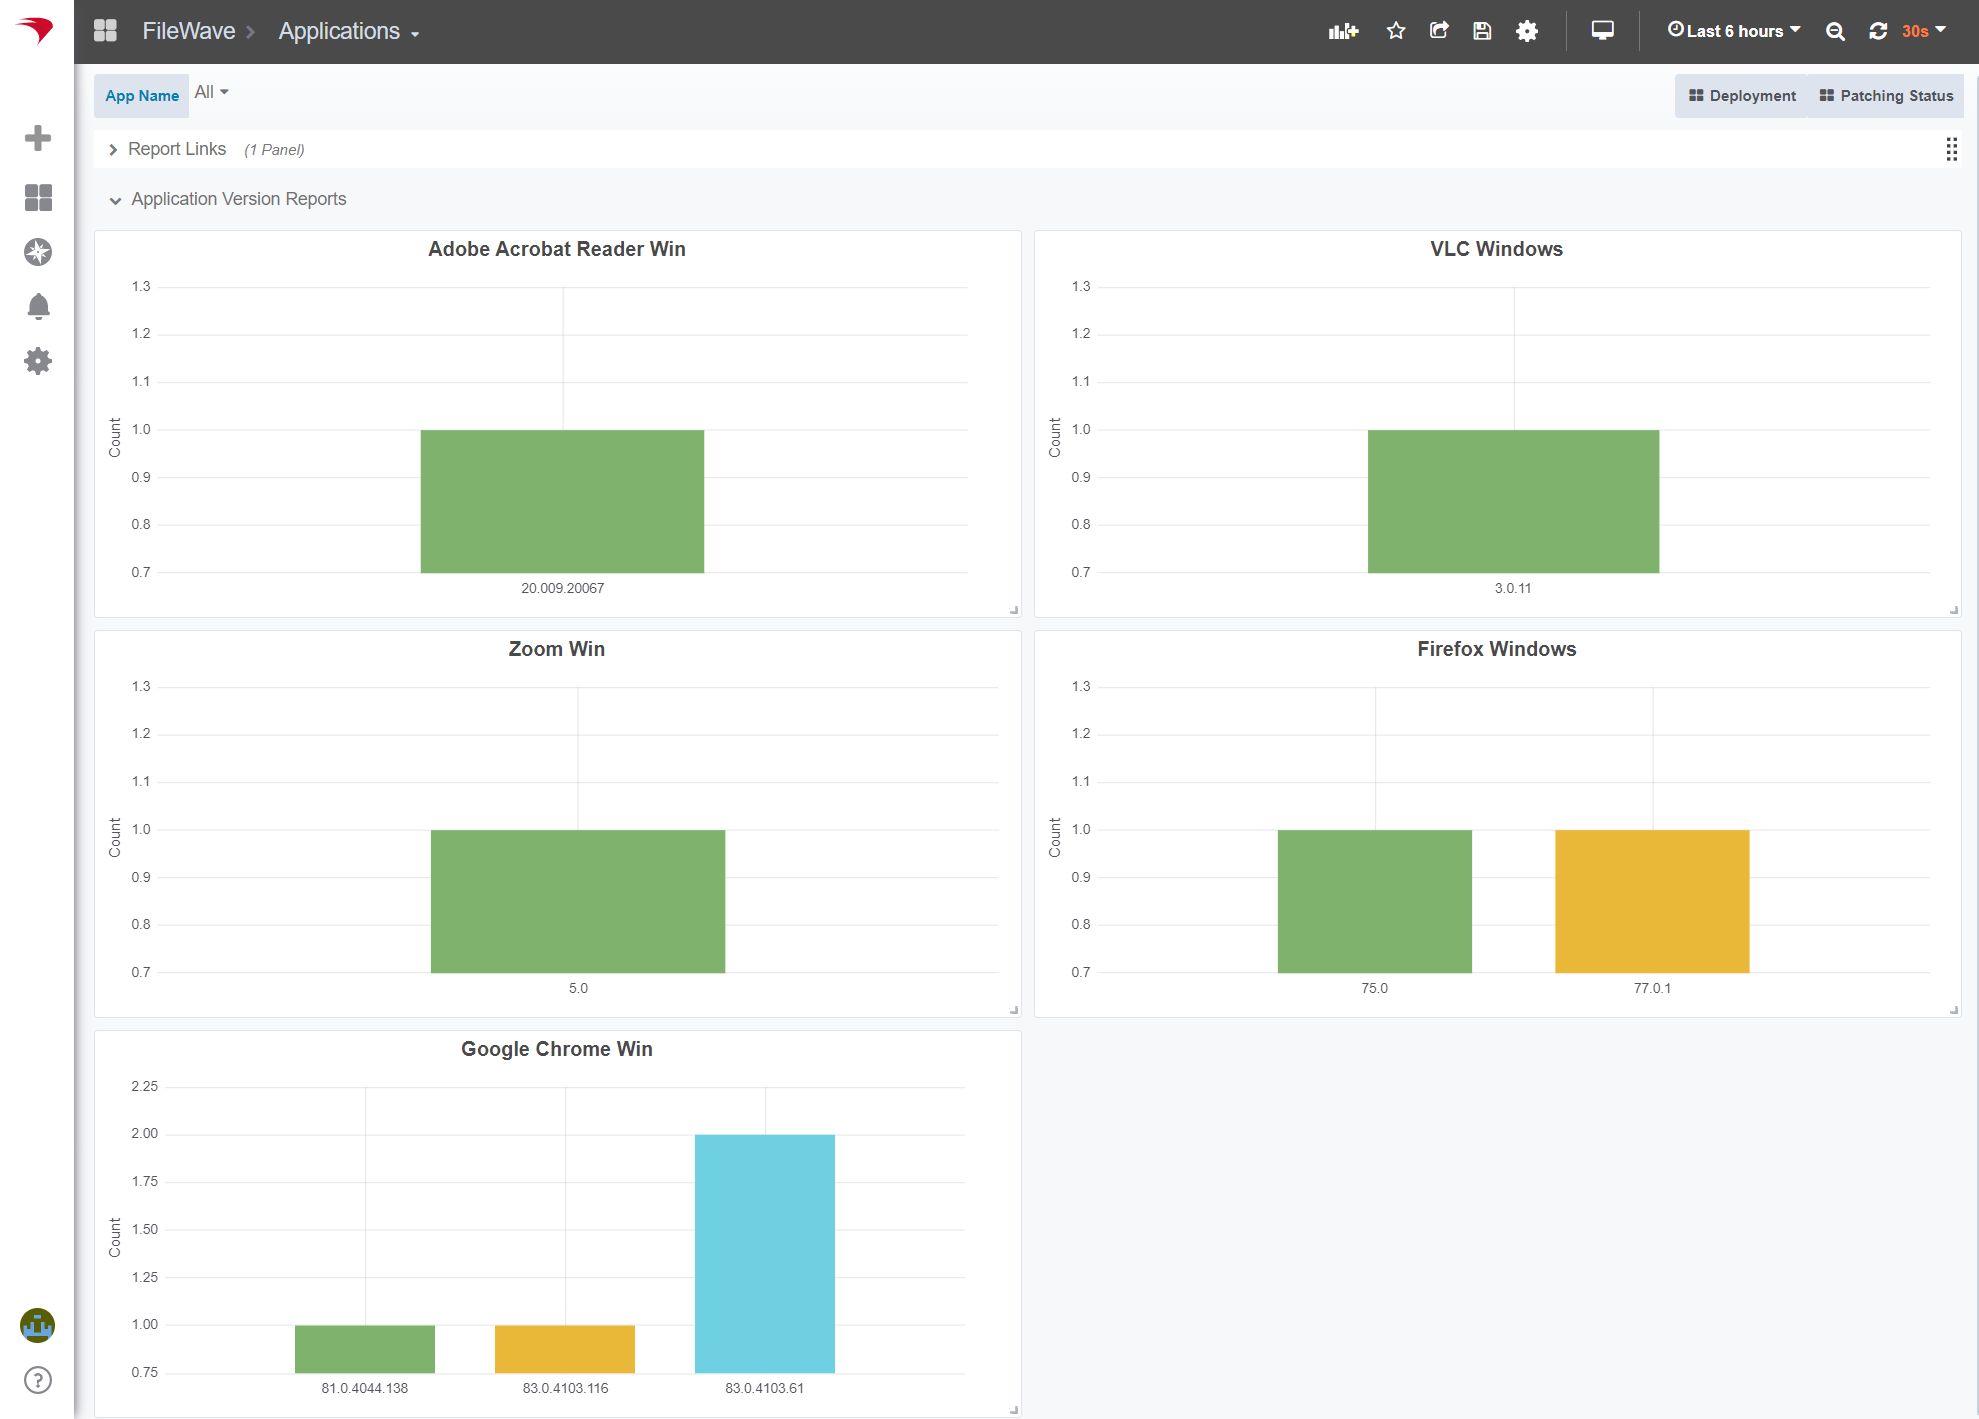
Applications
What apps are up to date? Are many people making use of older, perhaps insecure apps?

The Extra Metrics program provides sample queries for some popular apps, they are stored as inventory queries in FileWave.
Make your own app queries
Extra Metrics drives its dashboard from queries in FileWave.
Simply add new application queries into the 'Extra Metrics Queries - Apps' group and the Extra Metrics program will check them for required columns (app name + version) and include them automatically in this dashboard!
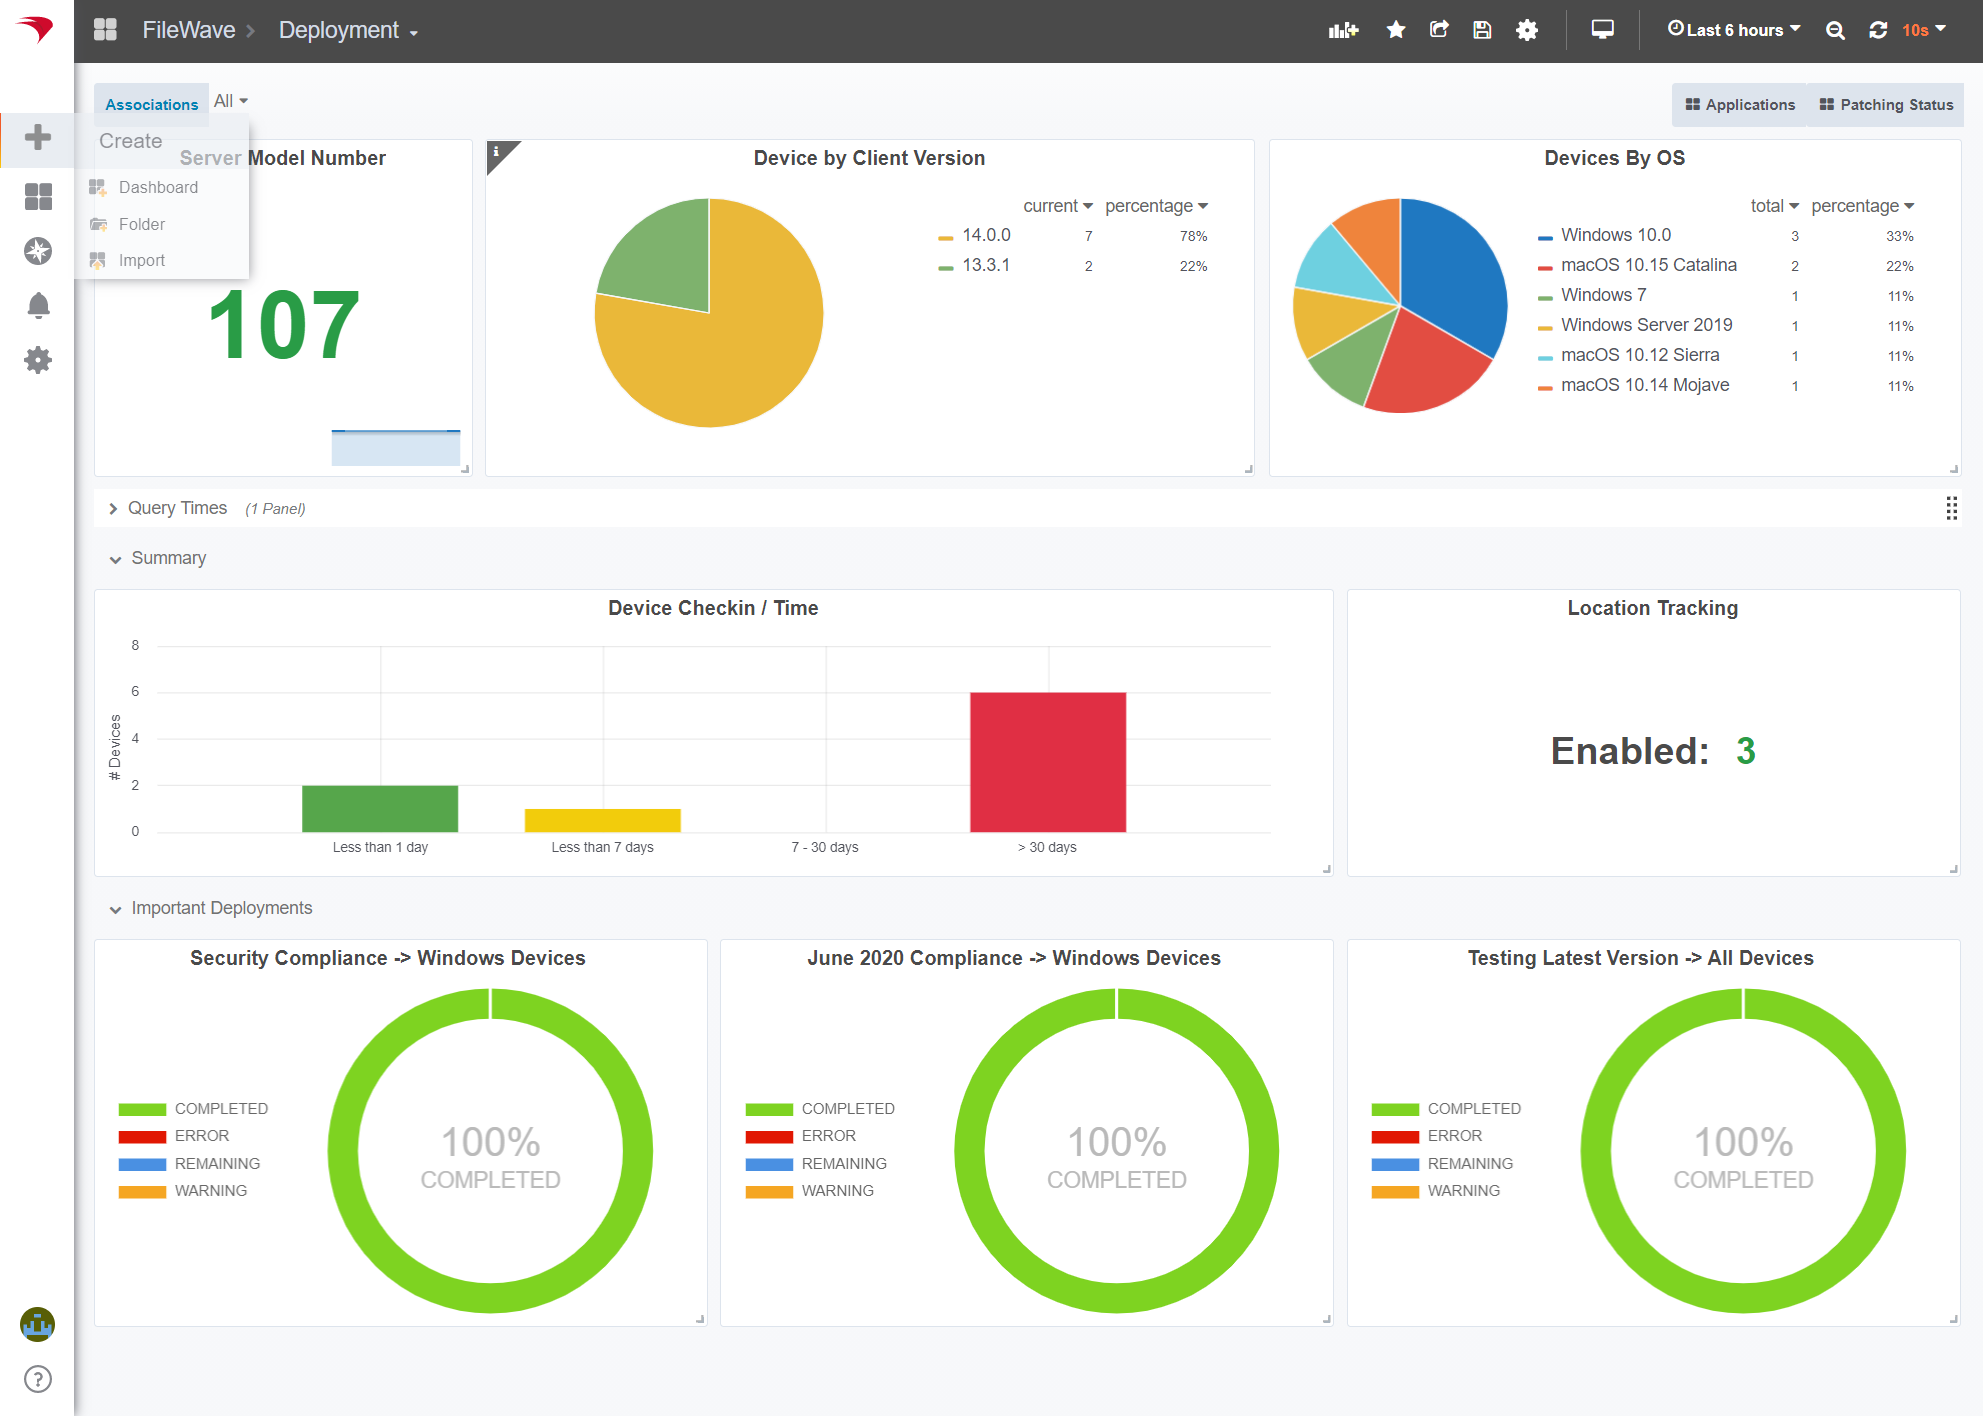
Deployment
Which clients are not checking in quickly enough? Are all my clients using the latest version of the FileWave Client software? How many devices are being tracked or marked as missing? Am I exposed to security problems due to old OS versions?
The Deployment dashboard provides sample panels showing the devices grouped by client version, as well as a bar graph showing how frequently devices are checking in.

Requirements / Check List
Minimum FileWave system requirements for success are as follows:
- FileWave Version 14+ - it will not work with v13
- FileWave Version 14+ must be running on a Linux Server
- SSH Access to the FileWave Server
- A base64 API Key specifically for Extra Metrics (with inventory and query create rights). You will require the base64 text, this can be obtained from the Manage Administrators -> Application tokens screen.
- Make sure your server has SSL certificates - self signed certs are not enough.
- You must have an externally reachable DNS name.
Review before beginning installation
These instructions will have you install Extra Metrics directly on your FileWave Server within a python virtual environment.
Important:
We only recommend installing Extra Metrics into its own python virtual environment. Doing so ensures that the introduction of this module cannot interfere with the operational integrity of your FileWave Server.
DO NOT INSTALL EXTRA METRICS DIRECTLY INTO THE PYTHON RUNTIME ENVIRONMENT OF YOUR FILEWAVE SERVER.
If you are unsure about the above statement - STOP - contact your FileWave SE or support. Your FileWave Server installation can be destroyed by mis-understanding the impact of this configuration.
Mac:
On a Mac, you must install a version of Python that allows non-codesigned binaries to be installed into the Python environment. On a Mac server: It is not possible to use the FileWave provided version of Python to run Extra Metrics
First Time Installation
Log into your FileWave Server using SSH, follow along to set up the virtual environment, install the Extra Metrics package and configure it. For the purpose of these instructions we are assuming a non-root user is being used.
Create a virtual environment for Extra Metrics:
$ /usr/local/filewave/python/bin/pyvenv $HOME/extra-metrics
$ source $HOME/extra-metrics/bin/activate
Now install the FileWave Extra Metrics package into the virtual environment:
(extra-metrics) $ pip install filewave-extra-metrics
Extra Metrics is now downloaded but not configured; before completing configuration you need an API Key (and SSL certs)
Create & configure an Inventory API Key
Extra Metrics should be configured with an Inventory API Key in order to access Inventory and create the inventory groups and queries. You will need the base64 text version of this API Key, which can be obtained from the Manage Administrators -> Application tokens dialog in the FileWave Administrator console.
Please create a unique access token (API Key) for the Extra Metrics module
The configuration step takes care of the following automatically:
- installation of a supervisord job to run the module
- installation of prometheus scrape configuration that targets the extra-metrics job
- installation & provisioning of 3 example dashboards into grafana
- upgrading grafana pie chart to the latest version
- storing the API key and DNS name
- dynamically injecting the external DNS name into the dashboards so that links to the FileWave web UI work correctly
Note: the extra-metrics-config command is part of the filewave-extra-metrics package; you will need the full path to this command if you are using sudo because sudo typically drops the existing PATH statement as a security measure.
The key to running the extra-metrics-config command is that it must be run with root privs. If you are already logged in as root you can simply do the following:
$ extra-metrics-config -a my_base64_API_key_value -e my_filewave_server_dns_name
Use the following commands to configure the server properly (you need to re-run this if the DNS name or API key changes):
$ export CONFIG_PATH=`which extra-metrics-config`
$ export API_KEY='insert-your-api-key-here'
$ export DNS_NAME='dns-name-of-fw-server-here'
$ sudo $CONFIG_PATH --api-key $API_KEY --external-dns-name $DNS_NAME

[extra-metrics] [INFO] loading the configuration from file /usr/local/etc/filewave/extra_metrics.ini
[extra-metrics] [INFO] saved configuration to file: /usr/local/etc/filewave/extra_metrics.ini
[extra-metrics] [INFO] wrote dashboard file: /usr/local/etc/filewave/grafana/provisioning/dashboards/extra-metrics-Applications.json
[extra-metrics] [INFO] wrote dashboard file: /usr/local/etc/filewave/grafana/provisioning/dashboards/extra-metrics-Deployment.json
[extra-metrics] [INFO] wrote dashboard file: /usr/local/etc/filewave/grafana/provisioning/dashboards/extra-metrics-PatchStatus.json
[extra-metrics] [INFO]
[extra-metrics] [INFO] Configuration Summary
[extra-metrics] [INFO] =====================
[extra-metrics] [INFO] API Key: eZBlNWFlNTYwLTqZZWEtNDMwYS1iNTa0LTlmZTkxODFjOdaxNH6=
[extra-metrics] [INFO] External DNS: srv.cluster.tech
[extra-metrics] [INFO] detected FileWave instance running version: 14.0.0
Restarting Services
If this is the first time you have installed the Extra Metrics module; you will need to tell supervisord to reload its configuration and to start the extra-metrics job.
$ /usr/local/filewave/python/bin/supervisorctl update
And you should restart Grafana so it can import the new dashboards.
$ fwcontrol dashboard restart
Validating
Note: it can take a few seconds (60 or so) for the metrics to be collected by prometheus and made available.
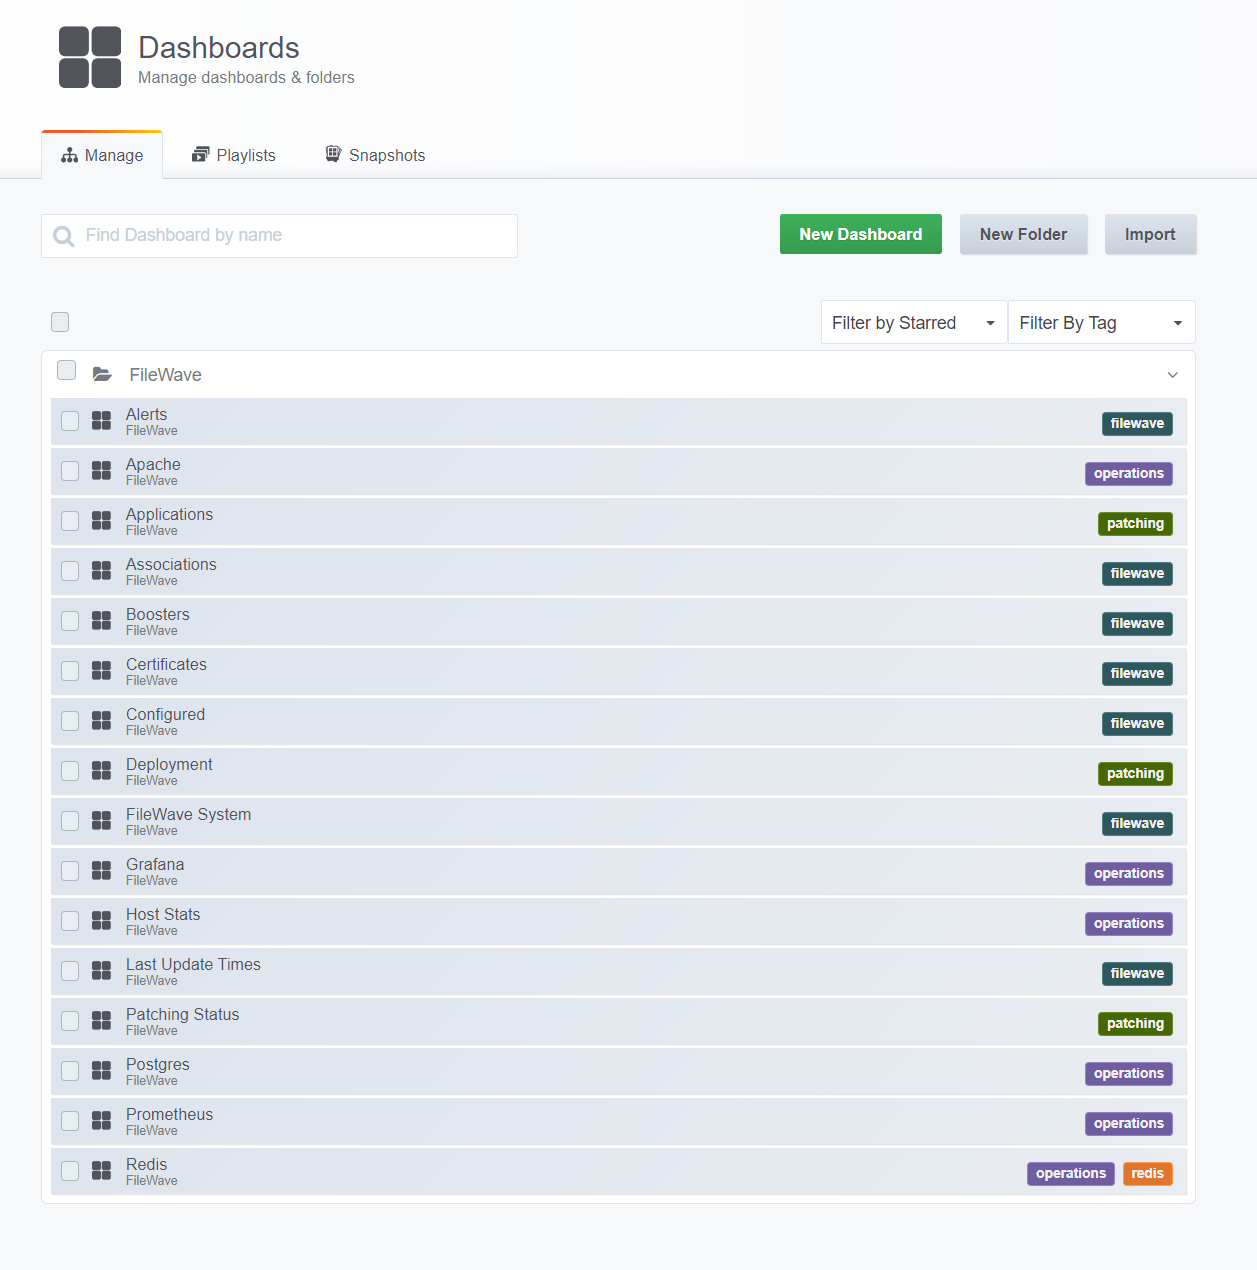
When you view the list of dashboards available in Grafana, you'll see 3 new ones - each with a 'patching' tag, as shown below:

To upgrade the Extra Metrics module; just run the install command again but include an '--upgrade' flag. It is recommended to run the "config" portion of the setup again to make sure that any configuration & dashboard panel changes have been applied as well and then restart services.
$ pip install --upgrade filewave-extra-metrics
$ sudo $CONFIG_PATH
$ /usr/local/filewave/python/bin/supervisorctl update
$ /usr/local/filewave/python/bin/supervisorctl restart extra_metrics
Upgrading to a Release Candidate
To install a release candidate, run the install command again but include the '--pre' flag.
$ pip install --upgrade --pre filewave-extra-metrics
$ sudo $CONFIG_PATH
$ /usr/local/filewave/python/bin/supervisorctl update
$ /usr/local/filewave/python/bin/supervisorctl restart extra_metrics
Misc.
Hint: don't skip this - SSL Certs
Make sure you have an SSL certificate, it must be valid, trusted by everyone (not just the server) and absolutely under no circumstances should it be self signed.
Do this - you'll save yourself untold pain. Trust me I'm still healing.
How can I be notified of updates?
Subscribe to this RSS feed: https://pypi.org/rss/project/filewave-extra-metrics/releases.xml
Device Health - how is it calculated?
The whole fleet of devices is continuously sending data back to the FileWave Inventory system which is used to calculate device health.
The health of a device is calculated using three components:
- Check-in days: the number of days since the device last checked into filewave
- Disk free space: the proportion of free disk space left on the device
- Patching; the number & type of patches still outstanding (based on what the client device has requested)
NOTE: The dashboard exposes a single state; but in reality the device has patch, check-in and disk state. The dashboard is simply exposing the WORST state overall.
Device Health Details
Checkin-days: If check-in days isn't known, the state is UNKNOWN. If it's < 7 the state is OK, < 14 the state is WARNING otherwise the state is ERROR
Disk space: If the disk space details are unknown the state is UNKNOWN, otherwise percentage disk space left is calculated (%left). If %left > 20% the state is OK, if %left is < 5% the state is ERROR otherwise the state is WARNING.
Patching: If there are any critical patches outstanding (unassigned, remaining or in an error / warning state), the state is ERROR. If there are any normal patches outstanding the state is WARNING. If there are no patches outstanding the device state is OK.
What metrics are being exposed to prometheus?
Metrics
extra_metrics_http_request_time_taken - REST queries made by extra metrics are timed; the response time is stored in a series of buckets within this metric.
extra_metrics_application_version - a summary of how many devices are using a particular app & version
extra_metrics_software_updates_by_state - buckets of all the software updates by state - the value is the number of devices in each state, this includes completed updates. The states are:
- Requested: total number of software updates requested (think of this as devices * updates)
- Unassigned: total number of software updates not assigned to a device (devices * updates)
- Assigned: the total number of updates associated / assigned to a device
- Remaining: the total number of updates that are in-progress that have yet to be completed
- Completed: the total number of completed updates
- Error / Warning: the total number of errors / warnings
extra_metrics_software_updates_by_critical - lists all the updates, indicating the number of normal vs critical updates currently known by the server.
extra_metrics_software_updates_by_popularity - list of software updates and the number of devices still needing the update (unassigned), completed updates are not included in this count.
extra_metrics_software_updates_by_age - list of software updates and their age in days, all updates including completed ones are included here. The value of the metric is the age in days (from now).
extra_metrics_software_updates_remaining_by_device - list of devices and the number of [critical] updates they have remaining to be installed, completed updates are not included in this count.
extra_metrics_devices_by_checkin_days - interesting stats on a per device basis, days since checked, compliance status.
extra_metrics_per_device_modelnum - provides a value of the model number per device.
extra_metrics_per_device_compliance - provides a value of the compliance state per device
extra_metrics_per_device_client_version - number of devices rolled up by client version
extra_metrics_per_device_platform - number of devices rolled up by platform
extra_metrics_per_device_tracked - number of devices being tracked
extra_metrics_per_device_locked - number of devices locked
Reference
Adjust supervisorctl to include --storage.tsdb.allow-overlapping-blocks?
Developers
To upload to PyPi, ensure you have the credentials in a pypi.config file (not checked into source control). To rebuild the package use ./rebuild_for_pypi.sh, to upload the package to PyPi use ./upload_to_pypi.sh.
An example pypi.config file contains:
[pypi]
username = __token__
password = pypi-AgEIcH.....<add your really long token here>
Versioning
It can be very convenient to publish a release candidate to PyPi in order to make testing of the install scripts easier.
The versioning is controlled by the setup.py file.
setuptools.setup(
    name="filewave-extra-metrics",
    version="1.0.36rc6"
Some things to rememeber:
-
if this is the first time you are pushing an RC - always increment the major revision first. For example, if the current revision is 1.0.35, then you should change the version for the RC to 1.0.36rc1
-
to upgrade installations with the currently published RC, use the following command:
$ pip install --upgrade --pre filewave-extra-metrics
Changelog
07-Aug-2020 (v45)
- made the check-in days panel use log2 for the y-axis, smoothing out peaks in data
06-Aug-2020 (v44)
- adjusted health status such that devices that have not checked in are considered "Ok" instead of "Error"
- fixed the client query to return all device types; not just desktop devices - which makes device counts accurate across all the client metrics.
- fixed an issue that could result in duplicate queries being injected into the 'Extra Metrics Queries - Apps' reports group.
- added the ability to override logging (default level is now WARNING not INFO), use the env value EXTRA_METRICS_LOGLEVEL and specify DEBUG, INFO, ERROR or WARNING as appropriate.
- fixed up the device health mapping that caused some devices to appear as "Unknown".
- adjusted the health panel to be an instant query.
- adjusted the in-progress software patches panel to show everything except requested, assigned device data - resulting in a more natural view of the progress.
- adjusted the #patches / time panel to match the data in the in-progress software patches panel so they show data consistent with each other.
28-Jul-2020 (v43)
- fixed: datetime parse error in software updates due to differently formatted date data for mobile/desktops
01-Jul-2020 (v36)
- fixed: look for zmq_subscribe_curve.keypair in /usr/local/filewave/certs, events are now received for both compat and secure modes of FileWave Server.
- fixed: software update status is now driven entirely from a new web ui based endpoint which makes it possible to deliver a visualization of patch progress
- fixed: the 'health' metrics per device now make use of feedback from software update - so the number of critical vs normal patches outstanding impacts the health calculation
- fixed: bad/missing data caused a crash in some of the compliance calculations.
- new: additional log messages on startup to help describe why an abort might happen (bad api keys, no data returned from health checks)
- new: added unit tests for the software update aggregations via the web rest API
- changed: redefined the software update metrics to distinguish between completed patches, and everything else
23-Jun-2020 (v35)
- new (and experimental): works on Mac; but requires a brew installed Python instance; the built-in FileWave python 3.7 binaries will not work as they don't allow non codesigned PyPi packages to be installed. FileWave Extra Metrics uses numpy, which is unsigned.
- new option (--dont-verify-tls) for extra-metrics-config; turns off TLS verification - the change is stored in configuration
19-Jun-2020 (v32):
- new: configuration for the polling delay, default is 30m (but re-queries happen automatically on model update and query changes)
- new: work on making it possible to run this on a Mac server (experimental at this point)
- cleaned up links on the Patch Status dashboard and fixed the tags/links to other dashboards
- wrote unit tests to make sure that the dashboard JSON is correct before deploying it
- corrected install/pip requirements that were missing
17-Jun-2020 (v29):
- experimental: re-runs app queries if any new query is updated, model update is run - this paves the way for reducing the number of polling requests being made, once more events are being sent from the FW server
- the app version dashboard now properly reflects the queries in the group 'Extra Metrics Queries - Apps', there is now one panel for each query.
- the app version dashboard now contains a quicklinks panel; allowing users to quickly get into the web UI for each of their app queries
- the server version check is now performed via a REST call instead of using local binaries and parsing that result
- changed to asyncio under the hood to allow for subscriptions to FW server events and removed dependancy on TimeLoop module
