MPAndroidChart/iOSChart for Xamarin Forms Custom Renderer
A powerful 🚀 Android/iOS chart view / graph view library, binding support for Xamarin.Forms, supporting line- bar- pie- radar- bubble- and candlestick charts as well as scaling, dragging and animations.
Available on NuGet:


MPAndroidChart Binding
Add assembly references
xmlns:ultimateChart="clr-namespace:UltimateXF.Widget.Charts;assembly=UltimateXF"
Setup for iOS project (add to AppDelegate before LoadApplication)
UltimateXFSettup.Initialize();
Setup for Android project (add to MainActivity before LoadApplication)
UltimateXFSettup.Initialize(this);
Required:
-
[Xamarin.Forms](>= 3.1.0.697729)
-
Your app could not run on simulator(iOS)
-
Install Xamarin.Swift package for iOS project(maybe if your app can't start)
[Xamarin.Swift] (>= 1.0.7)
-
You can downgrade swift support version for you project or your device (just download this project source and downgrade version of library for each project)
LineChart & BarChart
    <ultimateChart:SupportLineChartExtended
	       x:Name="chart"
           HorizontalOptions="FillAndExpand"
           VerticalOptions="FillAndExpand"
           DrawBorders="false"
           DoubleTapToZoomEnabled="false" />
DataBinding
        var entries = new List<EntryChart>();
        var entries2 = new List<EntryChart>();
        var labels = new List<string>();

 	    var random = new Random();
    for (int i = 0; i < 7; i++)
    {
	entries.Add(new EntryChart(i, random.Next(1000,50000)));
	entries2.Add(new EntryChart(i, random.Next(1000,50000)));
	labels.Add("Entry" + i);
    }
 	    var FontFamily = "";
        switch (Device.RuntimePlatform)
        {
            case Device.iOS:
                FontFamily = "Pacifico-Regular";
                break;
            case Device.Android:
                FontFamily = "Fonts/Pacifico-Regular.ttf";
                break;
            default:
                break;
        }
        var dataSet4 = new LineDataSetXF(entries, "Line DataSet 1")
        {
            CircleRadius = 10,
            CircleHoleRadius = 4f,
            CircleColors = new List<Color>(){
                Color.Accent, Color.Red, Color.Bisque, Color.Gray, Color.Green, Color.Chocolate, Color.Black
            },
            CircleHoleColor = Color.Green,
            ValueColors = new List<Color>(){
                Color.Accent, Color.Red, Color.Bisque, Color.Gray, Color.Green, Color.Chocolate, Color.Black
            },
            Mode = LineDataSetMode.CUBIC_BEZIER,
            ValueFormatter = new CustomDataSetValueFormatter(),
            ValueFontFamily = FontFamily
        };

        var dataSet5 = new LineDataSetXF(entries2, "Line DataSet 2")
        {
            Colors = new List<Color>{
                Color.Green
            },
            CircleHoleColor = Color.Blue,
            CircleColors = new List<Color>{
                Color.Blue
            },
            CircleRadius = 3,
            DrawValues = false,

        };

        var data4 = new LineChartData(new List<ILineDataSetXF>() { dataSet4,dataSet5 });

        chart.ChartData = data4;
        chart.DescriptionChart.Text = "Test label chart description";
        chart.AxisLeft.DrawGridLines = false;
        chart.AxisLeft.DrawAxisLine = true;
        chart.AxisLeft.Enabled = true;

        chart.AxisRight.DrawAxisLine = false;
        chart.AxisRight.DrawGridLines = false;
        chart.AxisRight.Enabled = false;

        chart.AxisRight.FontFamily = FontFamily;
        chart.AxisLeft.FontFamily = FontFamily;
        chart.XAxis.FontFamily = FontFamily;

        chart.XAxis.XAXISPosition = XAXISPosition.BOTTOM;
        chart.XAxis.DrawGridLines = false;
        chart.XAxis.AxisValueFormatter = new TextByIndexXAxisFormatter(labels);
Chart types:
Screenshots are currently taken from the original repository, as they render exactly the same :-)
-
LineChart (with legend, simple design)

-
LineChart (with legend, simple design)
-
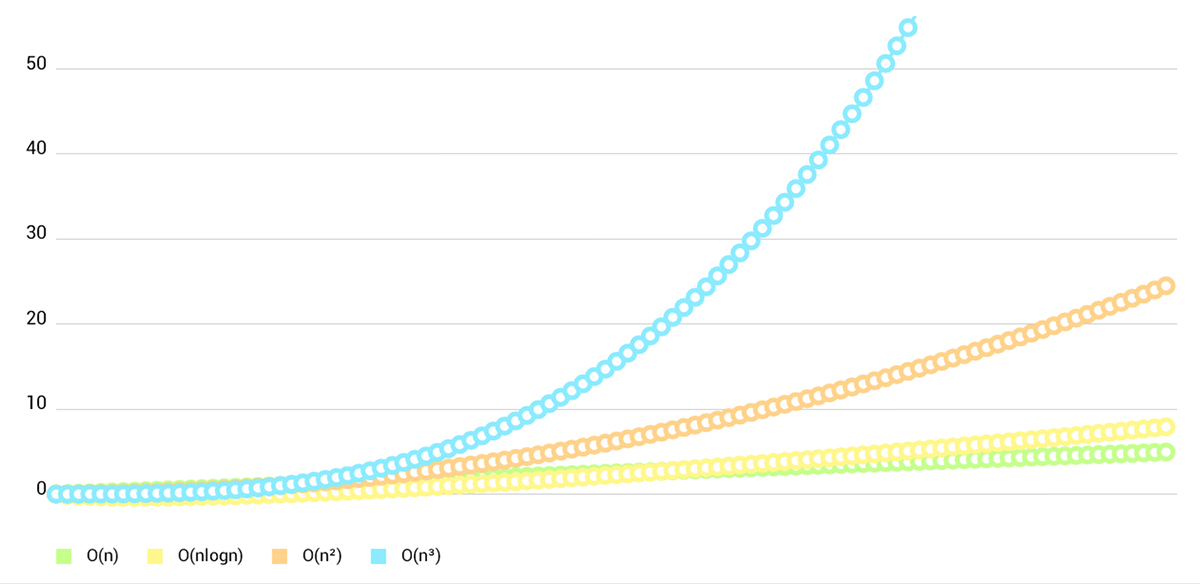
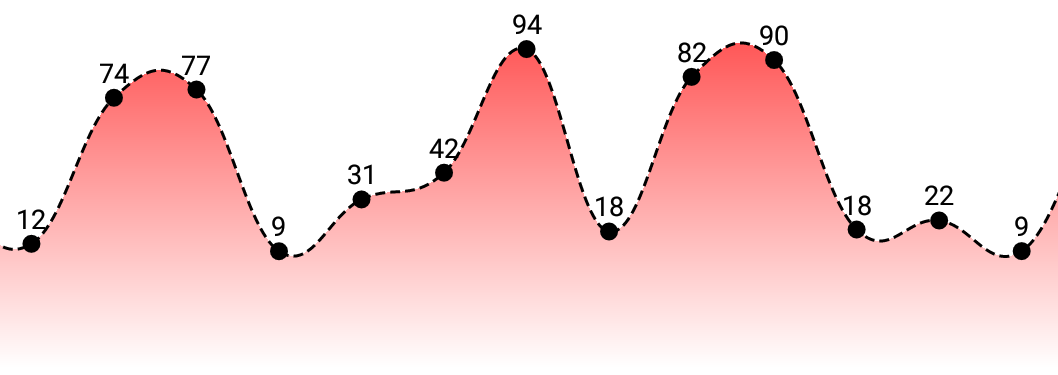
LineChart (cubic lines)
-
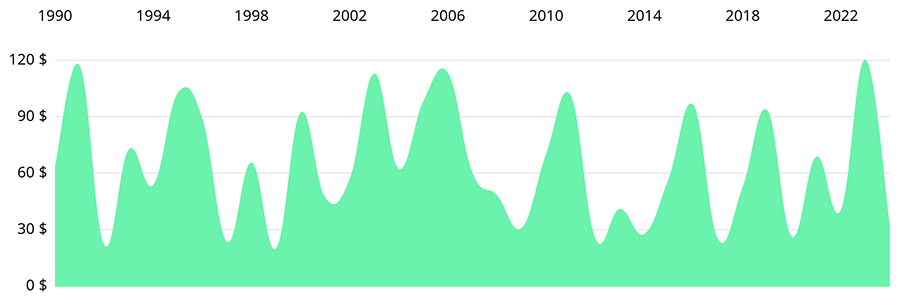
LineChart (gradient fill)
-
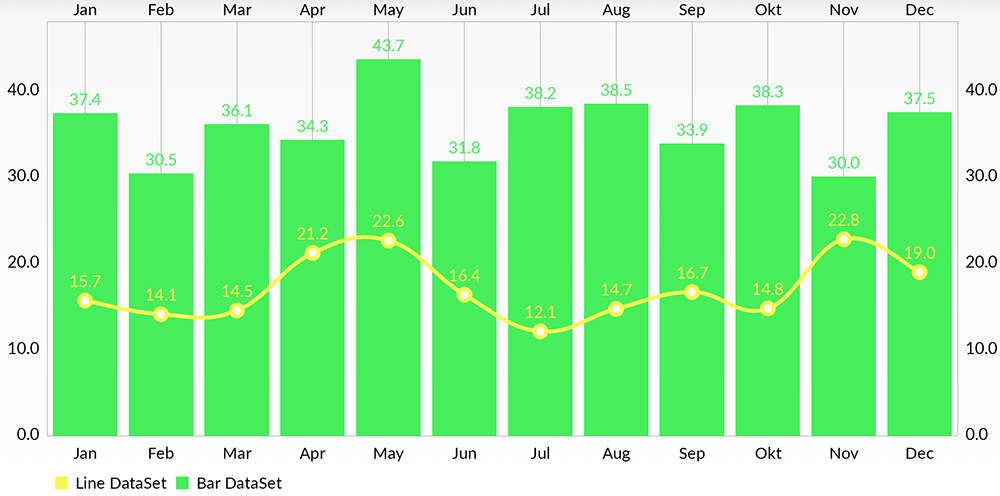
Combined-Chart (bar- and linechart in this case)
-
BarChart (with legend, simple design)

- BarChart (grouped DataSets)

- PieChart (with selection, ...)

- ScatterChart (with squares, triangles, circles, ... and more)

- CandleStickChart (for financial data)

- BubbleChart (area covered by bubbles indicates the value)

- RadarChart (spider web chart)

License
You can use this library for any project, or custom, edit it if you want, no need license and permissions
Special thanks Daniel Cohen Gindi & Philipp Jahoda


