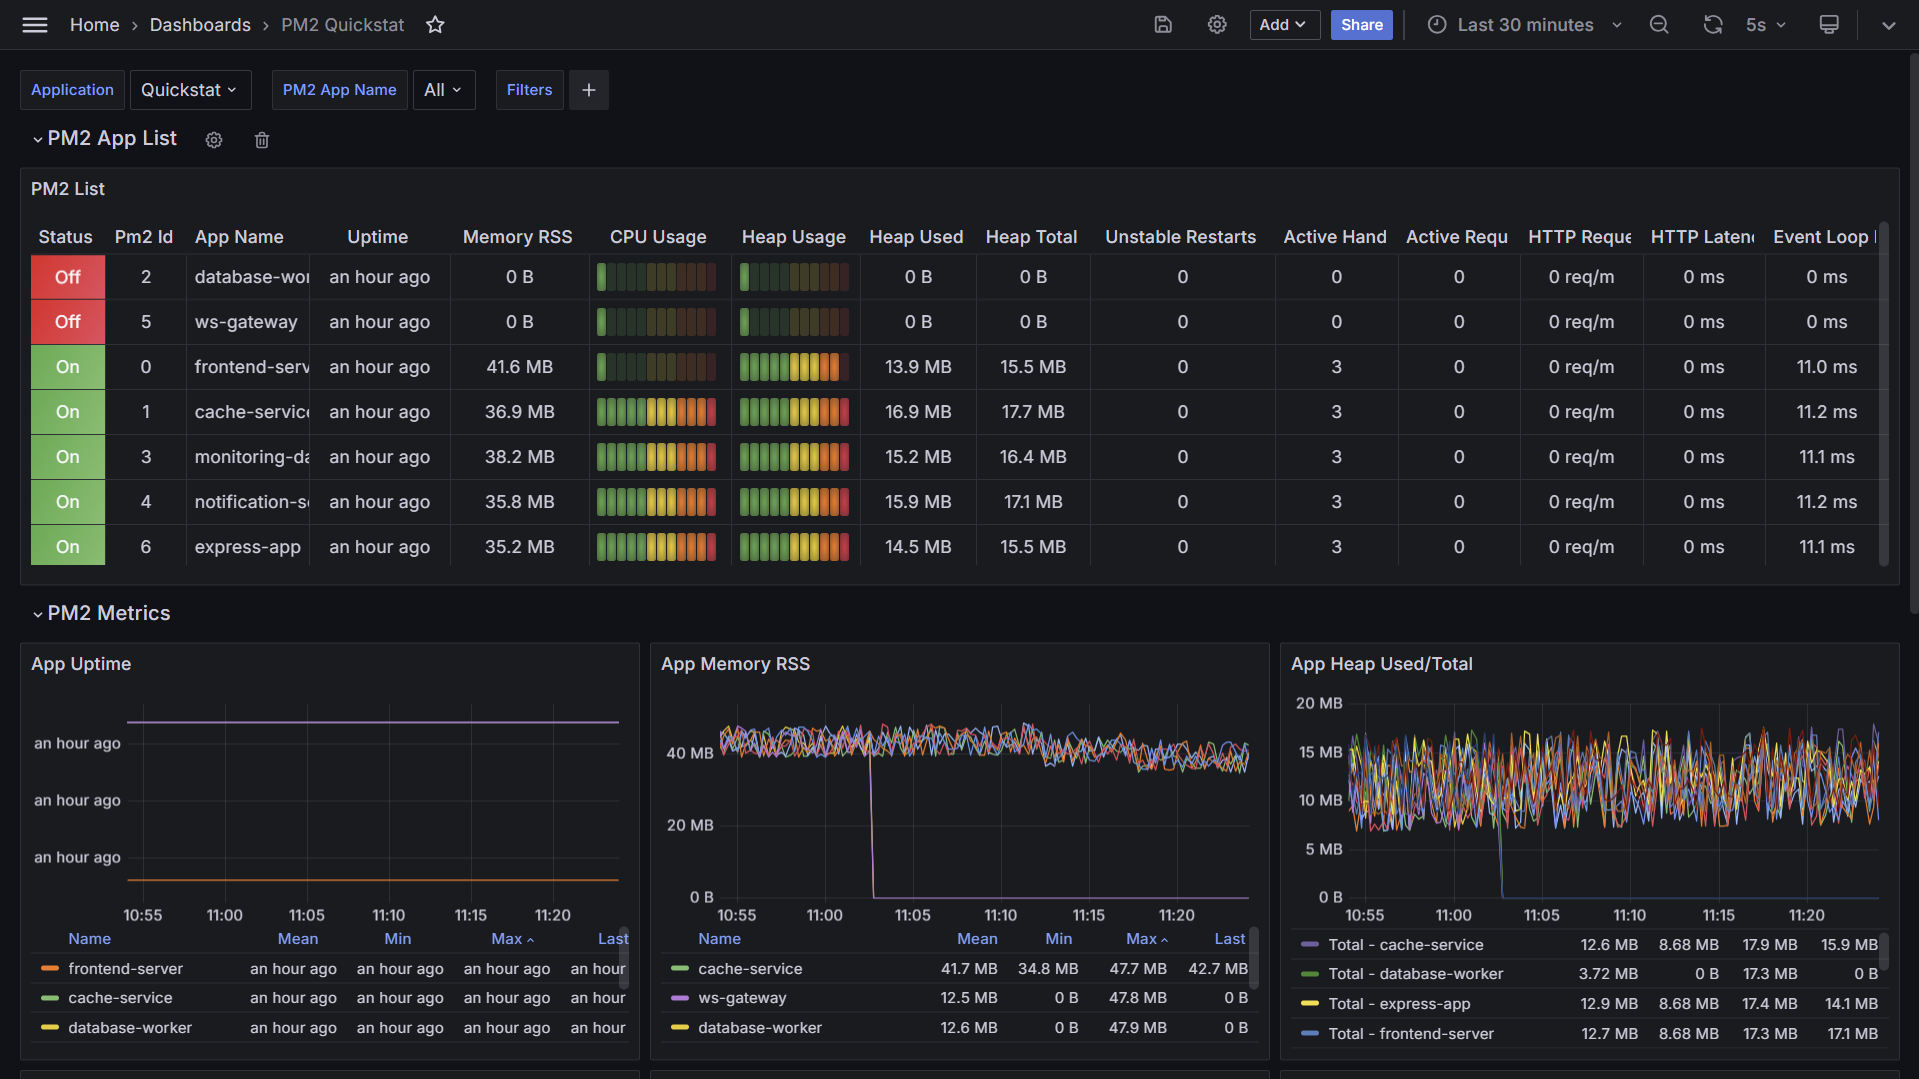
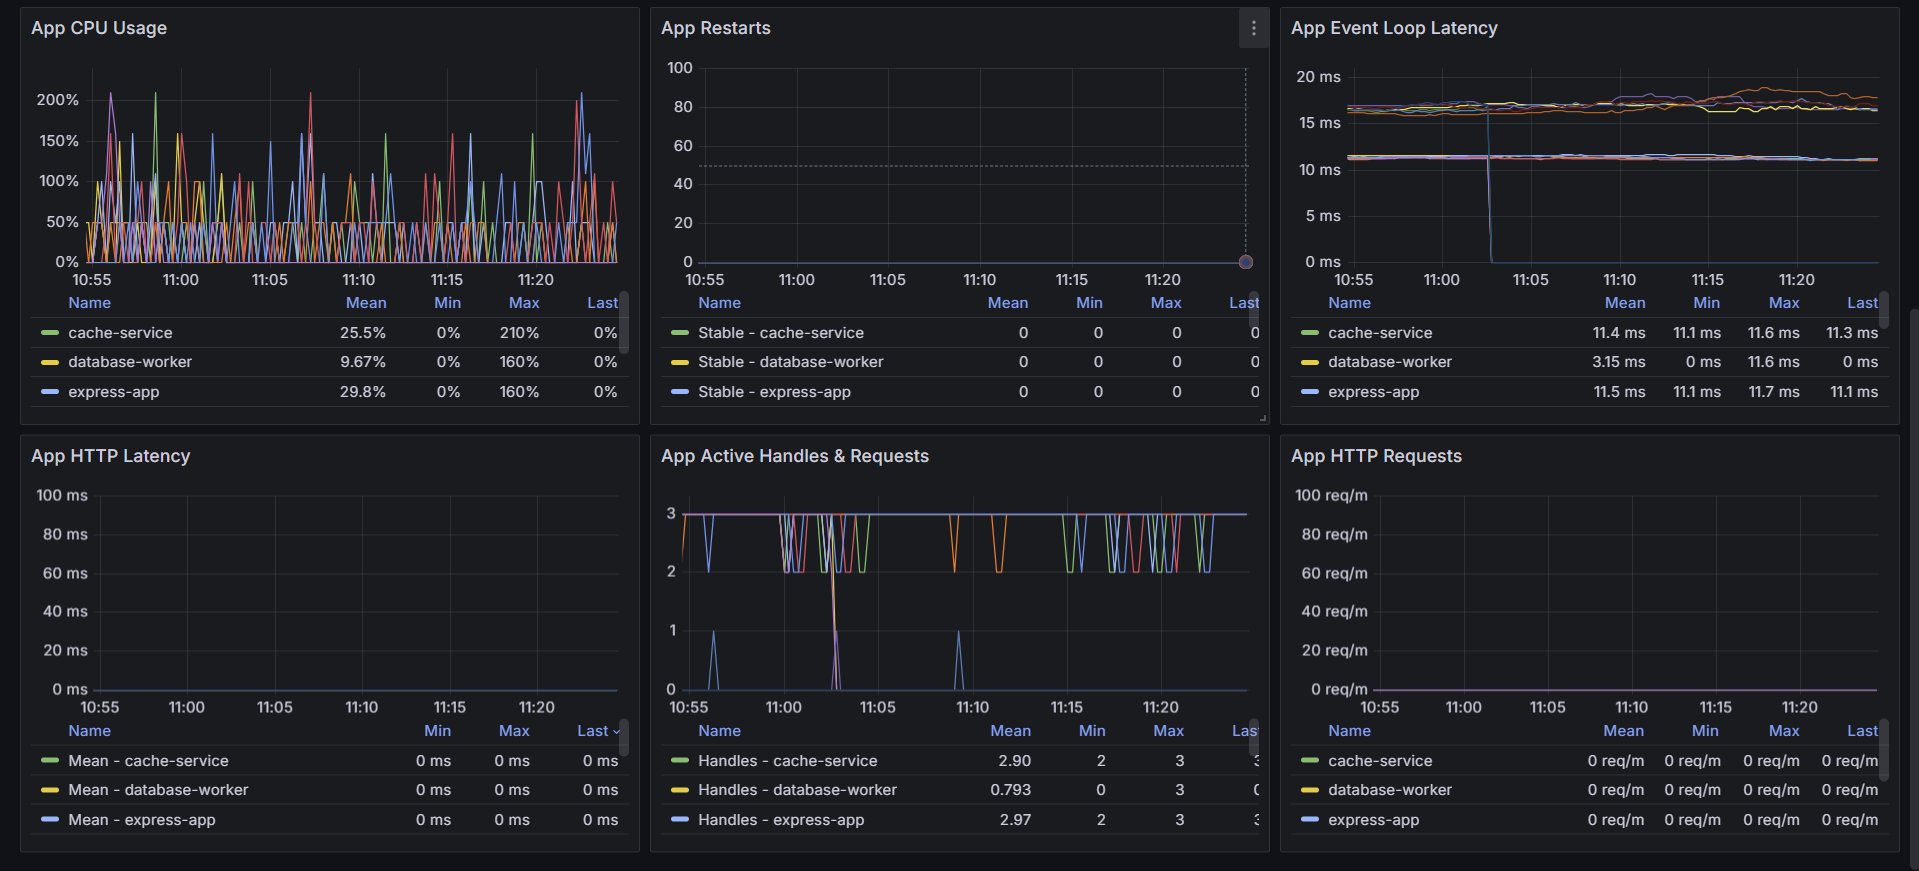
PM2 Monitoring Plugin
The QuickStat PM2 Plugin offers seamless integration with PM2 instances, allowing effortless monitoring of key metrics. It exports these metrics to Prometheus, enabling visualization in Grafana dashboards.
If you are new to QuickStat and its component, feel free to check the official documentation for a detailed breakdown.
Installation
Start by installing the QuickStat core package, the data source used by grafana and then the PM2 plugin:
npm install @quickstat/core
npm install @quickstat/prometheus
npm install @quickstat/pm2
Getting Started
If you use docker and want to get started quickly, you can check the following docker-setup, which allows you to skip the setup and directly use the plugin. Once you have setup docker, continue on Step 3.
If your unfamiliar with QuickStat's plugins, then keep in mind that you can also use other strategies such as (PushGateway) for exposing metrics or even combine your dashboard with other plugins.
If you want to set up Prometheus and Grafana manually, follow the steps below:
1. Setup Prometheus and Grafana
-
Install Prometheus: Follow the official documentation to install Prometheus on your system.
-
Install Grafana: Refer to the official documentation for instructions on installing Grafana.
-
Configure Prometheus Data Source in Grafana: After installing Grafana, configure Prometheus as a data source. Go to Grafana settings, add a new data source, and specify the URL where Prometheus is running.
2. Import Dashboard to Grafana
Once Prometheus and Grafana are set up, you can add following Dashboard. Navigate to the Grafana dashboard page, click on "Import" and paste the dashboard template URL. Then, customize the dashboard as needed.
3. Expose PM2 Metrics
To expose the metrics to prometheus using the QuickStat PM2 Plugin, use the following code snippet:
import { Client as QuickStatClient } from '@quickstat/core'
import { Pm2Plugin } from '@quickstat/pm2'
import { PrometheusDataSource, ScrapeStrategy } from '@quickstat/prometheus'
import pm2 from 'pm2'
import http from 'http'
const quickStatClient = new QuickStatClient() < PrometheusDataSource < ScrapeStrategy >> ({
metrics: [],
plugins: [
new Pm2Plugin({
excludeMetrics: [],
pm2,
}),
],
dataSource: new PrometheusDataSource({
strategy: new ScrapeStrategy(),
}),
})
http.createServer(async (req, res) => {
const response = await quickStatClient.dataSource?.strategy?.getResponse()
if (response) {
res.writeHead(200, response.headers)
res.end(response.file)
}
}).listen(3242)
4. Start the Application
After setting up the code, start the application. The metrics will be available at http://localhost:3242 in Prometheus format and will be scraped by Prometheus, which will then be used for visualization in Grafana.
Configuration
DataSource
The example above uses the PrometheusDataSource with the ScrapeStrategy. The ScrapeStrategy exposes the prometheus file on the given endpoint for being scraped from prometheus. You can also use the PushGatewayStrategy to push the metrics to the PushGateway of Prometheus.
If you would like to use other data sources, you can take a look at the available data sources in the @quickstat/core package
Plugin
The PM2 Plugin requires the pm2 package to be passed as an argument. You can also exclude pm2 metrics which should not be processed by the plugin. The plugin uses key value mapping for extracting the value from the pm2 metric object. On version compatibility issues, take a look at the package.json for the supported versions.
| excludeMetrics | Array of metrics to exclude | [] |
| pm2 | The pm2 package, which is used to get your running instances | pm2 |
Contributing and Issues
If you have any issues or feature requests, feel free to open an issue on the GitHub repository


