Research
/Security News
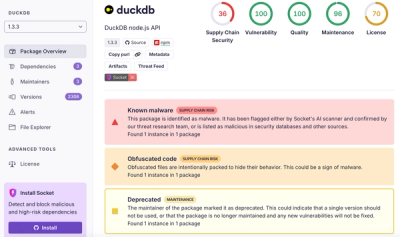
DuckDB npm Account Compromised in Continuing Supply Chain Attack
Ongoing npm supply chain attack spreads to DuckDB: multiple packages compromised with the same wallet-drainer malware.
@amilabs/echarts
Advanced tools

ECharts is a free, powerful charting and visualization library offering an easy way of adding intuitive, interactive, and highly customizable charts to your commercial products. It is written in pure JavaScript and based on zrender, which is a whole new lightweight canvas library.
Now ECharts is an incubator project of Apache Software Foundation. Please check its incubator status here
You may choose one of the following methods:
npm install echarts --saveBuild echarts source code:
Execute the instructions in the root directory of the echarts: (Node.js is required)
# Install the dependencies from NPM:
npm install

# If intending to build and get all types of the "production" files:
npm run release
# The same as `node build/build.js --release`

# If only intending to get `dist/echarts.js`, which is usually
# enough in dev or running the tests:
npm run build
# The same as `node build/build.js`

# Get the same "production" files as `node build/build.js`, while
# watching the editing of the source code. Usually used in dev.
npm run watch
# The same as `node build/build.js -w`

# Check the manual:
npm run help
# The same as `node build/build.js --help`
Then the "production" files are generated in the dist directory.
More custom build approaches can be checked in this tutorial: Create Custom Build of ECharts please.
If you wish to debug locally or make pull requests, please refer to contributing document.
https://github.com/ecomfe/awesome-echarts
ECharts GL An extension pack of ECharts, which provides 3D plots, globe visualization, and WebGL acceleration.
Extension for Baidu Map 百度地图扩展 An extension provides a wrapper of Baidu Map Service SDK.
vue-echarts ECharts component for Vue.js
echarts-stat Statistics tool for ECharts
ECharts is available under the Apache License V2.
Please refer to Apache Code of Conduct.
Deqing Li, Honghui Mei, Yi Shen, Shuang Su, Wenli Zhang, Junting Wang, Ming Zu, Wei Chen. ECharts: A Declarative Framework for Rapid Construction of Web-based Visualization. Visual Informatics, 2018.
FAQs
A powerful charting and visualization library for browser
We found that @amilabs/echarts demonstrated a not healthy version release cadence and project activity because the last version was released a year ago. It has 5 open source maintainers collaborating on the project.
Did you know?

Socket for GitHub automatically highlights issues in each pull request and monitors the health of all your open source dependencies. Discover the contents of your packages and block harmful activity before you install or update your dependencies.

Research
/Security News
Ongoing npm supply chain attack spreads to DuckDB: multiple packages compromised with the same wallet-drainer malware.

Security News
The MCP Steering Committee has launched the official MCP Registry in preview, a central hub for discovering and publishing MCP servers.

Product
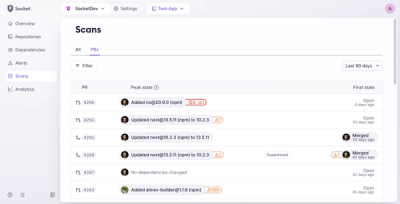
Socket’s new Pull Request Stories give security teams clear visibility into dependency risks and outcomes across scanned pull requests.