CanvasJS JavaScript Charts - Official
CanvasJS is a JavaScript Charting Library for creating interactive charts & graphs for your web pages. Library supports a wide range of chart types including bar, line, area, pie, doughnut charts, etc. Charts work with all the popular Technologies & Frameworks like React, Angular, jQuery, PHP, etc.
Browser Support
| 4+ ✔ | 12+ ✔ | 3.6+ ✔ | 4+ ✔ | 9+ ✔ | 8 ✔ |
Important Links
Installing CanvasJS JavaScript Charts
There are multiple ways to install CanvasJS JavaScript Charts. You can directly add script-tag to include it from CDN or download it from official site or install it from NPM registry. Please refer documentation page for more information.
Install Charts via NPM
npm install --save @canvasjs/charts
See npm documentation to know more about npm usage.
After CanvasJS script is installed, it can be imported using different module formats like AMD, CommonJS, etc.
//Load CanvasJS Charts
import * as CanvasJS from "@canvasjs/charts";
//var CanvasJS = require("@canvasjs/charts");
//Intantiate Chart
var chart = new CanvasJS.Chart("container", {
//Chart Options - Check https://canvasjs.com/docs/charts/chart-options/
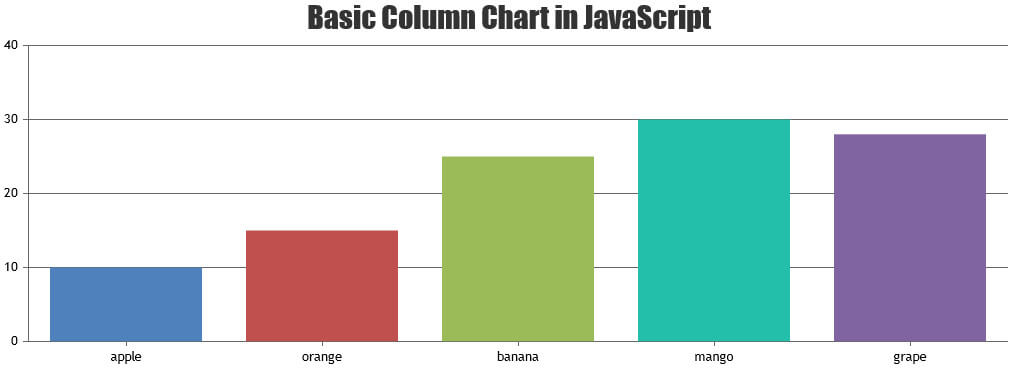
title:{
text: "Basic Column Chart in JavaScript"
},
data: [{
type: "column",
dataPoints: [
{ label: "apple", y: 10 },
{ label: "orange", y: 15 },
{ label: "banana", y: 25 },
{ label: "mango", y: 30 },
{ label: "grape", y: 28 }
]
}]
});
//Render Chart
chart.render();
Using CanvasJS Charts via CDN
You can access CanvasJS Charts from our CDN directly.
<script src="https://cdn.canvasjs.com/ga/canvasjs.min.js"></script>
Download from Official Site
You can download the JavaScript charting library along with examples from our official download page. Save it in your project directory & add it in your application.
<script src="canvasjs.min.js"></script>
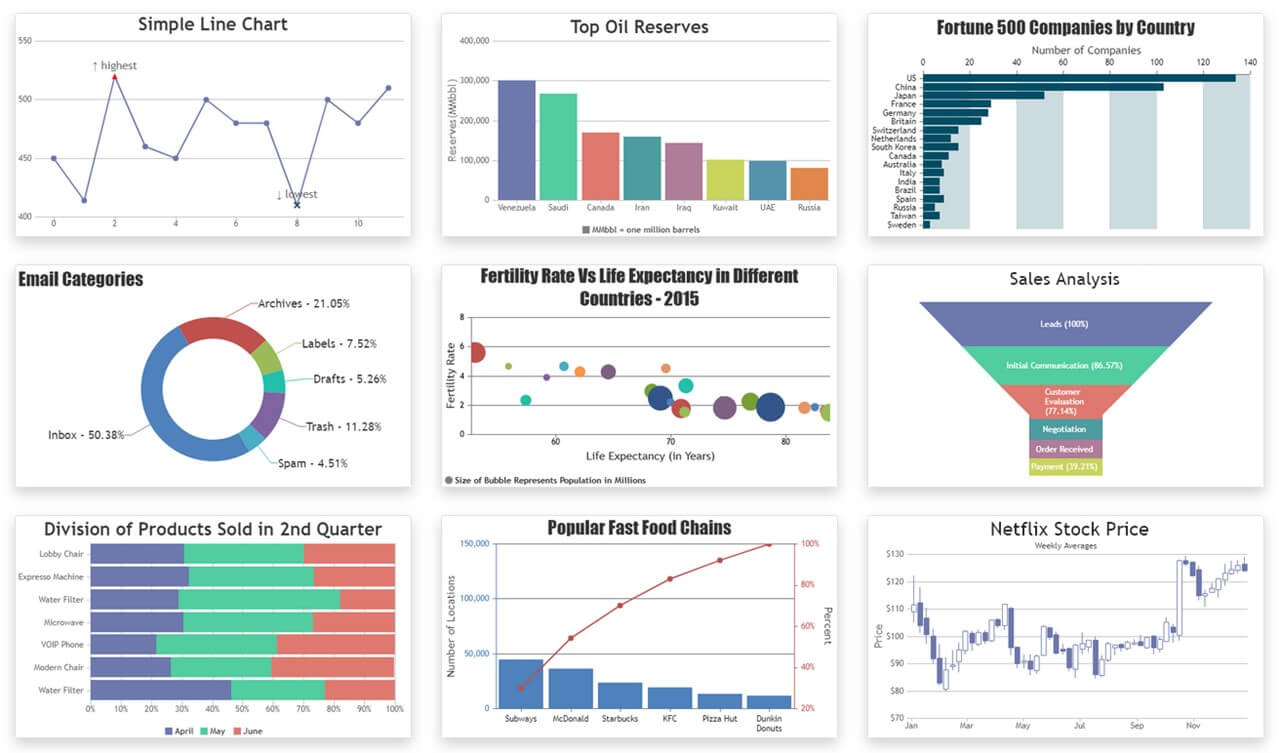
Interactive JavaScript Charts
JavaScript Chart with Multiple Y-axes
JavaScript Chart with Zooming / Panning
Related Chart Packages
License
Commercial use of CanvasJS Chart requires a commercial license. Without a commercial license you can use it for evaluation (or demonstrations/testing) purposes. Students, Educational Institutions, Personal Websites using CanvasJS for non-commercial purposes are qualified for the free license. Check out License Page to know more about licenses.