CanvasJS Vue Charts Plugin - Official
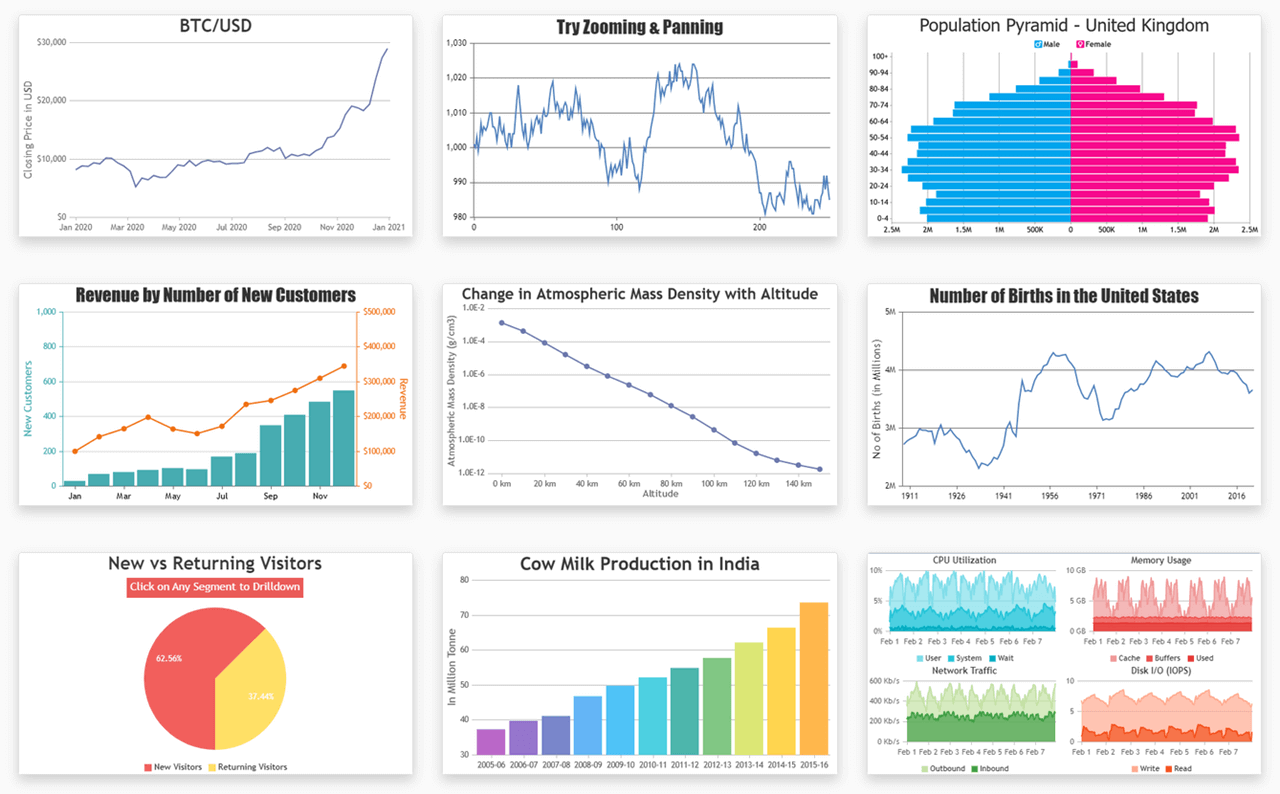
CanvasJS Vue Chart Plugin for creating interactive charts and graphs for your Vue.js applications. Library supports a wide range of chart types including bar, line, area, pie, doughnut, candlestick & more. It's also bundled with features like interactivity, animation, zooming / panning, exporting as image, etc.
Important Links
Installing CanvasJS Vue Charts
Install CanvasJS Vue Charts package to your Vue application via NPM.
Install Vue Charts via NPM
npm install @canvasjs/vue-charts
See npm documentation to know more about npm usage.
Import Vue Chart plugin & install it
Import the Vue Charts plugin to your Vue.js application & install it.
import { createApp } from 'vue'
import App from './App.vue'

import CanvasJSChart from '@canvasjs/vue-charts';

const app = createApp(App);
app.use(CanvasJSChart); // install the CanvasJS Vuejs Chart Plugin
app.mount('#app');
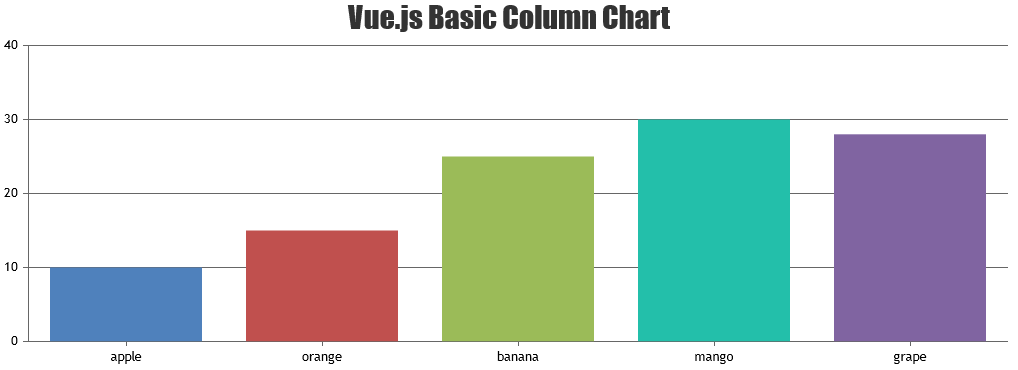
Set the chart-options & create chart
Set the chart-options in app.vue & use 'CanvasJSChart' selector to create chart inside template tag.
<!-- App.vue -->
<script>
export default {
  data() {
    return {
      chart: null,
      options: {
        animationEnabled: true,
        title:{
          text: "Vue.js Basic Column Chart"
        },
        data: [{
          type: "column",
          dataPoints: [
            { label: "apple",  y: 10 },
            { label: "orange", y: 15 },
            { label: "banana", y: 25 },
            { label: "mango",  y: 30 },
            { label: "grape",  y: 28 }
          ]
        }]
      }
    }
  }
}
</script>
<template>
    <CanvasJSChart :options="options"/>
</template>
Vue Chart with Animation
Vue Chart with Multiple Y-axes
Interactive Vue Chart
Vue Chart with Zooming / Panning
Related Chart Packages