Security News
Deno 2.6 + Socket: Supply Chain Defense In Your CLI
Deno 2.6 introduces deno audit with a new --socket flag that plugs directly into Socket to bring supply chain security checks into the Deno CLI.
@cloudflare/chart-map
Advanced tools
Cloudflare map presentational components
Upgrading mapbox-gl in this package will cost up to an additional $10,000 a month! See: https://github.com/mapbox/mapbox-gl-js/releases/tag/v2.0.0
This package has been patched to add referrerPolicy support via yarn patch-commit.
Installation with yarn is recommended
$ yarn add @cloudflare/chart-map
All components in this package rely on MapBox and require access token in order to talk to MapBox API.
Use <MapProvider /> at the top of your component hierarchy to provide the access token along with other global configuration to all chart components.
<MapProvider /> accepts the following props:
accessToken: MapBox access token. Required by MapBox API to identify the client.referrerPolicy: MapBox requires referer header along with the access token in order to identify clients. If a client website uses a referer policy that prevents the browsers from sending the referer header (e.g., noreferrer or same-origin), all requests to MapBox API fail with 403 Unauthorized and prevent the chart components from rendering. This prop can be used to override the referrer policy for the requests to MapBox API. In the most cases you will want to set it to strict-origin-when-cross-origin. For more options, please refer to fetch API specification. For more context about this problem, see: https://github.com/mapbox/mapbox-gl-js/pull/12590.import React from 'react';
import { Box } from '@cloudflare/component-box';
import { MapProvider, MapChoropleth, MapBubble, MapLinks, MapHeatmap } from '../../src';
import ccs from './iso2-country-codes.json'; // ["AD","AE","AF","AG",...]
const MAPBOX_ACCESS_TOKEN = '' // read from env
// Choropleth data
const countryData = ccs.map(cc => ({
cc: cc,
val: Math.round(Math.random() * 1e3)
}));
// Bubble data
const N_BUBBLES = 30;
const MAX_VAL = 1000;
const groupColors = ['rgb(40,110,164)', 'rgb(166,30,32)'];
const bubbleData = [...Array(N_BUBBLES).keys()].map(idx => ({
lat: Math.random() * 180 - 90,
lng: Math.random() * 360 - 180,
value: Math.random() * MAX_VAL,
name: idx.toString(),
group: Math.floor(Math.random() * groupColors.length)
}));
// Links data
const linksData = [];
[
// CF offices
[37.7803628, -122.3957331],
[40.1189773, -88.2464608],
[30.2681573, -97.7445804],
[51.5047963, -0.1089703],
[1.278984, 103.848831]
].forEach((srcCoords, idx, pnts) => {
// Full mesh links
for (let i = idx + 1; i < pnts.length; i++) {
const dstCoords = pnts[i];
linksData.push({ src: srcCoords, dst: dstCoords });
}
});
// Heatmap data
const N_POINTS = 2000;
const heatmapData = [...Array(N_POINTS).keys()].map(() => ({
lat: Math.random() * 180 - 90,
lng: Math.random() * 360 - 180,
value: Math.random() * MAX_VAL
}));
const ViewComponent = () => (
<MapProvider accessToken={MAPBOX_ACCESS_TOKEN}>
<Box display="flex">
<Box flex="1" margin="5px">
<MapChoropleth
data={countryData}
countryDimension="cc"
valueDimension="val"
valueFormatter={d => d}
valueLabel="Units"
colorScaleExp={3}
onCountryClick={cc => console.info('Clicked:', cc)}
onCountryHover={cc => console.info('Hover country:', cc)}
/>
</Box>
<Box flex="1" margin="5px">
<MapBubble
data={bubbleData}
nameDimension="name"
latDimension="lat"
lngDimension="lng"
valueDimension="value"
valueLabel="Units"
valueFormatter={n => n.toPrecision(5)}
colorDimension={d => groupColors[d.group]}
maxRadius={25}
onBubbleClick={bubble => console.info('Clicked:', bubble)}
onBubbleHover={bubble => console.info('Hover state:', bubble)}
/>
</Box>
</Box>
<Box display="flex">
<Box flex="1" margin="5px">
<MapLinks
data={linksData}
srcLatDimension={({ src: [lat] }) => lat}
srcLngDimension={({ src: [_, lng] }) => lng}
dstLatDimension={({ dst: [lat] }) => lat}
dstLngDimension={({ dst: [_, lng] }) => lng}
colorDimension={() => 'orange'}
widthDimension={2}
opacityDimension={0.7}
/>
</Box>
<Box flex="1" margin="5px">
<MapHeatmap
data={heatmapData}
latDimension="lat"
lngDimension="lng"
valueDimension="value"
saturation={2}
pointRadius={60}
/>
</Box>
</Box>
</MapProvider>
);
export default ViewComponent;
FAQs
Cloudflare map presentational components
The npm package @cloudflare/chart-map receives a total of 662 weekly downloads. As such, @cloudflare/chart-map popularity was classified as not popular.
We found that @cloudflare/chart-map demonstrated a healthy version release cadence and project activity because the last version was released less than a year ago. It has 43 open source maintainers collaborating on the project.
Did you know?

Socket for GitHub automatically highlights issues in each pull request and monitors the health of all your open source dependencies. Discover the contents of your packages and block harmful activity before you install or update your dependencies.

Security News
Deno 2.6 introduces deno audit with a new --socket flag that plugs directly into Socket to bring supply chain security checks into the Deno CLI.

Security News
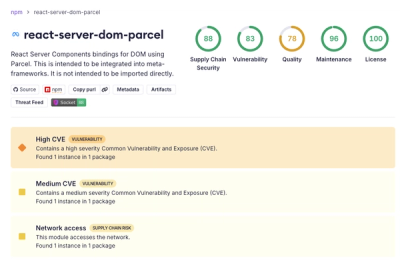
New DoS and source code exposure bugs in React Server Components and Next.js: what’s affected and how to update safely.

Security News
Socket CEO Feross Aboukhadijeh joins Software Engineering Daily to discuss modern software supply chain attacks and rising AI-driven security risks.