Research
Namastex.ai npm Packages Hit with TeamPCP-Style CanisterWorm Malware
Malicious Namastex.ai npm packages appear to replicate TeamPCP-style Canister Worm tradecraft, including exfiltration and self-propagation.
@condenast/perf-kit
Advanced tools
Perf kit is a toolchain for testing performance regressions in JavaScript code.
Perf kit is a toolchain for testing performance regressions in JavaScript code. While writing atjson, we created a set of tools for testing performance regressions in our code.
What resulted was this library that leverages the V8 profiler to collect metrics about the performance of our software that we could use to identify:
Install perf-kit into the repository that you want to add profiles to:
npm install --save-dev @condenast/perf-kit
After it's been installed, add a file under perf-kit that will contain the performance suites to run:
import { run, suite } from "@condenast/perf-kit";

run(
  suite({
    name: "my-first-profiler",
    cases: [],
    runner: test => {
      // Run your code here
    }
  })
);
You can pass as many suites to the run function as you would like.
A suite is made up of the suite name, cases to be run, and the suite runner.
The name is where profiles will be stored for the cpuprofiles that will be generated by the profile script. Cases will be run for every run of the suite. The test cases are shuffled between each run to introduce randomess into the runner to ensure that the results have a stronger significance (and is not due to run order).
The runner is a function that will receive a test case, and is the bit of code that will be measured when profiling.
profilenpx ts-node ./perf-kit profile --times=10
Options
times— The number of times to run each code block.out— The name of the directory to store the profiles. This can be a full path or a relative pathverbose— Output progress information during the running of the command.This will generate cpuprofiles for the whole performance suite.
comparenpx ts-node ./perf-kit compare baseline current
Performance test suites are defined in performance/index.ts and specify a number of test cases to be run by a runner function. Within a test suite, a test run will generate a .cpuprofile of the test runner acting on all of the test cases in a random order. To run the test suites, run npm run perf which by default will run each test suite 10 times and store the .cpuprofile files in performance/profiles/{test suite name}/current. It will additionally aggregate over the test runs to generate a timing.json file in the same directory. The timing file will have distribution data for the sample and cumulative times for each function sampled in the test runs. For now, only functions defined in packages in this repo are included in the tiing file.
Performance profile generation can be configured by including parameters to the npm script. Including a --baseline flag will store the output files in a baseline folder instead of current, or a different folder can be further specified if this is passed as an option. Additionally, the number of runs can be configured by including the --times option:
npm run perf -- --baseline new-baseline-folder --times 20
As a shortcut, npm run perf:baseline is equivalent to npm run perf -- --baseline baseline --times 10.
Once performance profiles are generated, we can compare the results of one baseline against another by running npm run perf-tstats which will perform a Student's T-Test for every function timing collected over the test runs, as collected in the respective timing.json file in the baseline folder. In short, we consider the timing for every function to be its own random variable, and the timing recorded in each test run to be a sample. The T-Test asks whether the population of timings for a function of sampled in one baseline meaningfully differ from those sampled from a different one. If they are found to be different (ie, if the 95% confidence interval of their difference is entirely positive or negative), their T-Test results are included in a {baseline1}-{baseline2}-tstat.json file in the baseline2 directory and their summary is output to the console. The output file will additionally include timing information for any added function calls sampled in baseline2 but not baseline1, and any dropped function calls sampled in baseline1 but missing from baseline2.
Comparison can be conifugred by included parameters to the npm script. A --baseline option can be included to specify the baseline to compare from, and a --current option can be included to specify the baseline to compare to. npm run perf-tstats is equivalent to npm run perf-tstats -- --baseline baseline --current current.
FAQs
Perf kit is a toolchain for testing performance regressions in JavaScript code.
The npm package @condenast/perf-kit receives a total of 444 weekly downloads. As such, @condenast/perf-kit popularity was classified as not popular.
We found that @condenast/perf-kit demonstrated a not healthy version release cadence and project activity because the last version was released a year ago. It has 382 open source maintainers collaborating on the project.
Did you know?

Socket for GitHub automatically highlights issues in each pull request and monitors the health of all your open source dependencies. Discover the contents of your packages and block harmful activity before you install or update your dependencies.

Research
Malicious Namastex.ai npm packages appear to replicate TeamPCP-style Canister Worm tradecraft, including exfiltration and self-propagation.

Product
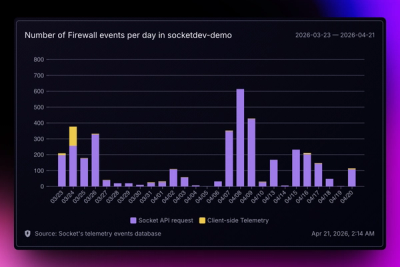
Explore exportable charts for vulnerabilities, dependencies, and usage with Reports, Socket’s new extensible reporting framework.

Product
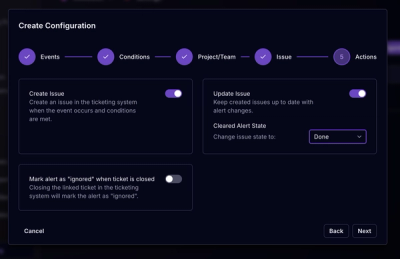
Socket for Jira lets teams turn alerts into Jira tickets with manual creation, automated ticketing rules, and two-way sync.