Research
/Security News
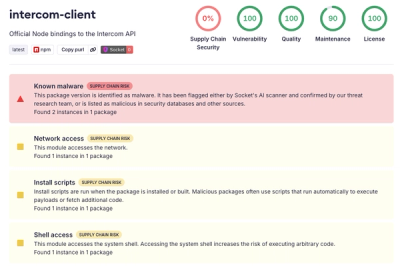
Intercom’s npm Package Compromised in Ongoing Mini Shai-Hulud Worm Attack
Compromised intercom-client@7.0.4 npm package is tied to the ongoing Mini Shai-Hulud worm attack targeting developer and CI/CD secrets.
@condenast/perf-timeline-cli
Advanced tools
Generate Chrome Performance Timelines via a command line interface
A command line interface for generating Chrome Performance timelines.
Proudly built by:
Generate a timeline, see how many Layout events occurred, and get the total JavaScript execution time using Big Rig.
Chrome DevTools' Performance panel is an industry standard for creating page load timelines to understand how a website renders. As nice as it is to be able to click a few buttons to generate a timeline, creating a Performance timeline from the command line extends the functionality to fit different workflows.
Prior to building this tool, I struggled with a few issues when generating timelines from the Chrome DevTools Performance panel.
Perf Timeline attempts to improve the developer experience by providing a fast interface to generate clean Performance timelines.
Perf Timeline CLI requires Node 8+ and a current version of Chrome to view generated timelines.
npm install -g @condenast/perf-timeline-cli
Generate a Performance timeline using defaults
perf-timeline generate https://www.wired.com
Generate a Performance timeline while throttling network
perf-timeline generate https://www.wired.com \
  --emulate-network-conditions \
  --latency 150 \
  --upload-throughput 0.75 \
  --download--throughput 1.6
Generate a Performance timeline while throttling CPU
perf-timeline generate https://www.wired.com \
  --set-cpu-throttling-rate \
  --rate 4
Generate a Performance timeline with screenshots
perf-timeline generate https://www.wired.com \
  --screenshots
Generate a Performance timeline and save to a custom location
perf-timeline generate https://www.wired.com \
  --path ~/my-timeline.json
generategenerate creates a Performance timeline for the URL passed to the command. The timeline is saved
as trace.json in the current directory. The timeline conditions can be adjusted using the
arguments documented below.
url (required; no default) - URL used to generate the Performance timelineLaunch options are passed to the puppeteer.launch() command. Not all options are currently
supported. Supported options are listed below. For more information, please see the Puppeteer
Documentation.
--ignore-https-errors (optional; false) - When --ignore-https-errors is passed, an HTTPS
errors will be ignored. This causes Chrome's default error behaviors when encountering HTTPS issues
to be ignored.--headless (options; true) - By default, Perf Timeline CLI runs in "headless" mode (i.e., without a visible
browser UI). To see a browser UI when generating the timeline, pass the --headless false to the
generate command. Please note that --no-headless is a synonym for --headless false.The Network Emulation Options allow you to generate a Performance timeline under specified network
conditions. To turn on network emulation, you must pass the --emulate-network-conditions flag
along with additional configuration options. These options mirror Chrome Headless' emulateNetworkConditions arguments.
All options are supported. Note that some arguments have been augmented for the CLI use case to
improve the product experience (e.g., throughout arguments us megabits per second instead of bytes
per second).
--emulate-network-conditions (optional; false) - In order to set network conditions for a
timeline generation session, you must pass the --emulate-network-conditions flag. This flag
allows the other Network Emulation Options to be respected. They will be completely ignored unless
this flag is set.--offline (optional; false) - Passing the --offline flag to the generate command emulate
a network disconnect.--latency (optional; 0) - Artificial, minimum latency between request sent and response header
received expressed in milliseconds (ms).--download-throughput (optional: -1) - The maximum download speed in megabits per second. Note
Chrome Headless' version of this argument uses bytes per second. Perf Timeline CLI uses megabits per
second as that is a more common measure of network throughput. -1 disables throttling.--upload-throughput (optional: -1) - The maximum upload speed in megabits per second. Note
Chrome Headless' version of this argument uses bytes per second. Perf Timeline CLI uses megabits per
second as that is a more common measure of network throughput.-1 disables throttling.--connection-type (optional: none) - A label of the supposed underlying network connection
type that the browser is using. Supported values are documented under Chrome Headless'
ConnectType documentation.The Set CPU Throttling Rate Emulation Options allow you to generate a Performance timeline under
specified CPU conditions. To turn on CPU emulation, you must pass the --set-cpu-throttling-rate
flag along with additional configuration options. These options mirror Chrome Headless'
setCPUThrottlingRate arguments.
All options are supported.
--set-cpu-throttling-rate (optional; false) - In order to set network conditions for a
timeline generation session, you must pass the --set-cpu-throttling-rate flag. This flag
allows the other Set CPU Throttling Rate Options to be respected. They will be completely ignored
unless this flag is set.--rate (optional; 1) - Sets the CPU throttling rate. The number represents the slowdown
factor (e.g., 2 is a "2x" slowdown).The Goto Options mirror the page.goto() method's options from Puppeteer. These options allow you
to configure how the page navigation is handled. All options are currently supported. Note that the
url option for page.goto is provided by the url, positional argument passed to generate. You
cannot override that option here. See the page.goto documentation for more
details.
--timeout (optional; 30) - Maximum time in seconds to load the page until the timeline
generation is stopped. Note that if you emulate the network or CPU, or if you set later
--wait-until values, you should increase --timeout to improve the chances of successfully
generating a timeline.--wait-until (optional; load) - The success event for the navigation. Puppeteer "waits until"
this event has occurred to finish the timeline. load, domcontentloaded, networkidle0, and
networkidle2 are supported. Note that --timeout takes precedence over --wait-until. If the
--wait-until event has not occurred before the --timeout time is reached, an error is thrown and
no timeline will be generated.The Tracing Options allow to you configure the options for Puppeteer's page.tracing.start()
method. All options are supported. See the page.tracing.start documentation for more
details.
--path (optional; ./trace.json) - The file path for where to save the trace.--screenshots (optional; false) - Passing the --screenshots flag causes Chrome to take
screenshots of the page as the timeline is generated. These screenshots are embedded in the tracing
file and are shown in DevTools when viewing the Performance timeline.--categories (optional; []) - The list of trace event categories to capture in the timeline.
This argument is passed as a comma separated list of categories. This option is useful if you wish
to reduce the overall size of the trace file. Note that limiting to certain categories only can
leave you with a timeline that does not appear to show anything when viewing in DevTools'
Performance panel. The best way to see the possible categories is to view a raw trace and look for
the cat value of events.This project is built on the shoulders of giants. It's nothing more than a convenience wrapper around some really exciting projects, including:
See the list of contributors who participated in writing this tool.
FAQs
Generate Chrome Performance Timelines via a command line interface
The npm package @condenast/perf-timeline-cli receives a total of 379 weekly downloads. As such, @condenast/perf-timeline-cli popularity was classified as not popular.
We found that @condenast/perf-timeline-cli demonstrated a not healthy version release cadence and project activity because the last version was released a year ago. It has 279 open source maintainers collaborating on the project.
Did you know?

Socket for GitHub automatically highlights issues in each pull request and monitors the health of all your open source dependencies. Discover the contents of your packages and block harmful activity before you install or update your dependencies.

Research
/Security News
Compromised intercom-client@7.0.4 npm package is tied to the ongoing Mini Shai-Hulud worm attack targeting developer and CI/CD secrets.

Research
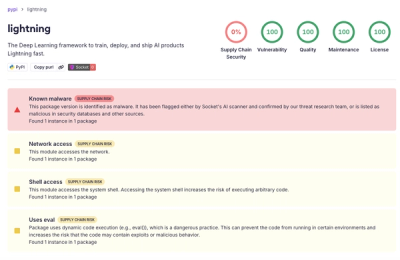
Socket detected a malicious supply chain attack on PyPI package lightning versions 2.6.2 and 2.6.3, which execute credential-stealing malware on import.

Research
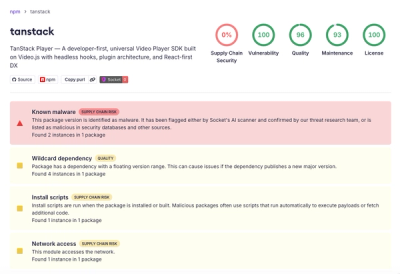
A brand-squatted TanStack npm package used postinstall scripts to steal .env files and exfiltrate developer secrets to an attacker-controlled endpoint.