Security News
Crates.io Users Targeted by Phishing Emails
The Rust Security Response WG is warning of phishing emails from rustfoundation.dev targeting crates.io users.
@custody/plugin-command-start-debugger
Advanced tools
Custody plugin to add a command to start the Node debugger
Users can start the Node debugger by starting a process with the inspect argument or --inspect
flag. However, if your process is run under a process monitor like Supervisor or even just nodemon,
you can't easily alter its arguments nor flags.
Luckily, Node lets you direct a running process to start the debugger by signalling the process with
'SIGUSR1'. However this method requires you to identify the process ID, which means reading it
out of your process monitor's logs, if it's logged at all. Also, Node will always start the debugger
on the same port, which prevents you from debugging multiple processes simultaneously.
And when you make a change to the process, you have to go through this rigamarole all over again.
This custody plugin fixes all that:
npm install -g @custody/plugin-command-start-debugger
Then launch custody-cli settings and add "@custody/plugin-command-start-debugger" to your
.custodyrc.
This module requires that you instrument every process you wish to debug with @custody/probe, please configure that before proceeding. See here for why.
After opening a process' details in custody

press 'd' to launch Chrome DevTools. If you wish to assign a different key, for instance "w", edit
the "@custody/plugin-command-start-debugger" line in your .custodyrc to look like the following:
{
  "plugins": [
    ["@custody/plugin-command-start-debugger", {
      "key": "w"
    }]
  ]
}
DevTools will open in a new Chromium instance due to limitations of Chrome's automation.
If the process restarts, DevTools will briefly disconnect and then reconnect when the process finishes restarting.
To stop debugging, simply close the DevTools tab in Chromium and/or Chromium itself.
We welcome bug reports and feature suggestions!
FAQs
Custody plugin to add a command to start the Node debugger
We found that @custody/plugin-command-start-debugger demonstrated a not healthy version release cadence and project activity because the last version was released a year ago. It has 1 open source maintainer collaborating on the project.
Did you know?

Socket for GitHub automatically highlights issues in each pull request and monitors the health of all your open source dependencies. Discover the contents of your packages and block harmful activity before you install or update your dependencies.

Security News
The Rust Security Response WG is warning of phishing emails from rustfoundation.dev targeting crates.io users.

Product
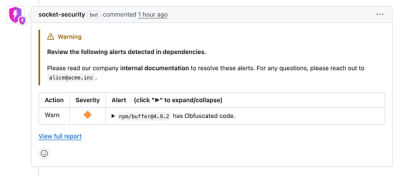
Socket now lets you customize pull request alert headers, helping security teams share clear guidance right in PRs to speed reviews and reduce back-and-forth.

Product
Socket's Rust support is moving to Beta: all users can scan Cargo projects and generate SBOMs, including Cargo.toml-only crates, with Rust-aware supply chain checks.