Security News
Crates.io Users Targeted by Phishing Emails
The Rust Security Response WG is warning of phishing emails from rustfoundation.dev targeting crates.io users.
@devgateway/dvz-ui-react
Advanced tools
A modular, embeddable React component library for data visualization and UI, built with TypeScript. Provides reusable components for charts, maps, dashboards, and more, with built-in support for internationalization and Redux integration.
A modular, embeddable React component library for data visualization and UI, built with TypeScript. This package provides a suite of reusable, customizable components and utilities for building rich data-driven applications, with a focus on embeddability and extensibility.
react-intl.npm install @devgateway/dvz-ui-react
# or
yarn add @devgateway/dvz-ui-react
Peer dependencies: You must have
reactandreact-dom(v18.3.1 or compatible) installed in your project.
import { components, getComponentByNameIgnoreCase } from '@devgateway/dvz-ui-react';

// Example: Render a chart component
const Chart = getComponentByNameIgnoreCase('chart');
<Chart {...props} />

// Or use directly from the components map
const { chart: ChartComponent } = components;
<ChartComponent {...props} />
The Chart component is one of the core embeddable components. It supports a wide range of chart types and is highly configurable via props and data attributes.
import { getComponentByNameIgnoreCase } from '@devgateway/dvz-ui-react';

const Chart = getComponentByNameIgnoreCase('chart');

// Example usage with minimal props
<Chart
  data-type="bar"
  data-height={400}
  data-csv={`category,value
A,30
B,50
C,20`}
  data-measures='{"csv": {"value": {"selected": true, "format": {"style": "decimal", "minimumFractionDigits": 0, "maximumFractionDigits": 0}}}}'
  data-color-by="index"
  data-show-legends="true"
  data-legend-position="right"
  data-x-label-color="#333"
  data-bar-color="#007bff"
  data-title="Sample Bar Chart"
/>
Key Props and Data Attributes:
data-type: Chart type (bar, line, pie, radar, etc.)data-csv: CSV string with your datadata-measures: JSON string defining which measures to display and their formatdata-color-by: How to color the chart (index, category, etc.)data-show-legends: Show/hide legends ("true"/"false")data-legend-position: Position of the legend ("right", "bottom", etc.)data-x-label-color, data-bar-color: Color customizationsdata-height: Chart height in pixelsTip: Many more attributes are supported for advanced customization. See the source of
src/embeddable/chart/index.jsxfor the full list.
Some of the main embeddable components include:
ChartMapViewPageGalleryPostsCarouselTabbedPostsDownloadNewsLetterSankeyChartSupersetChartSupersetDashboardBigNumberBigNumberTrendSee the src/embeddable directory for the full list.
You can register your own custom components and reducers:
import { customizer } from '@devgateway/dvz-ui-react';

customizer.registerCustomEmbeddables({
  myCustomComponent: MyComponent,
});

const MyComponent = customizer.getComponentByNameIgnoreCase('myCustomComponent');
src/embeddable/ — Main embeddable React componentssrc/redux/ — Redux utilities and reducerssrc/lib/ — Shared utilities and helperssrc/layout/ — Layout componentssrc/tracker/ — Tracking and analytics utilitiessrc/translations/ — Internationalization filesnpm run dev — Start development mode (watch mode for TypeScript and Vite)npm run build — Build the library for productionThis project uses strict TypeScript settings. See tsconfig.json for details.
The library is built with Vite and outputs both CommonJS and ES modules, as well as type declarations.
We welcome contributions! To get started:
git clone <repo-url>
cd data-viz-ui/packages/dvz-ui
npm install
npm run dev
npm run build
npm run lint
npm run typecheck
MIT
FAQs
A modular, embeddable React component library for data visualization and UI, built with TypeScript. Provides reusable components for charts, maps, dashboards, and more, with built-in support for internationalization and Redux integration.
We found that @devgateway/dvz-ui-react demonstrated a healthy version release cadence and project activity because the last version was released less than a year ago. It has 3 open source maintainers collaborating on the project.
Did you know?

Socket for GitHub automatically highlights issues in each pull request and monitors the health of all your open source dependencies. Discover the contents of your packages and block harmful activity before you install or update your dependencies.

Security News
The Rust Security Response WG is warning of phishing emails from rustfoundation.dev targeting crates.io users.

Product
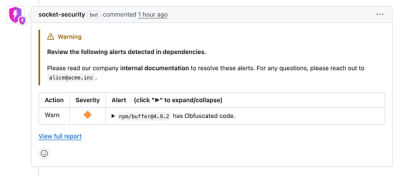
Socket now lets you customize pull request alert headers, helping security teams share clear guidance right in PRs to speed reviews and reduce back-and-forth.

Product
Socket's Rust support is moving to Beta: all users can scan Cargo projects and generate SBOMs, including Cargo.toml-only crates, with Rust-aware supply chain checks.