FlowFuse Dashboard
Documentation can be found here: https://dashboard.flowfuse.com
Installation
FlowFuse Dashboard is available in the Node-RED Palette Manager. To install it:
- Open the menu in the top-right of Node-RED
- Click "Manage Palette"
- Switch to the "Install" tab
- Search
node-red-dashboard
- Install the
@flowfuse/node-red-dashboard package (not node-red-dashboard)
The nodes will then be available in your editor for you to get started.
If you want to use npm to install your nodes, you can instead follow these instructions
Note: this package was previously published under the name @flowforge/node-red-dashboard. That package has now been deprecated and will not receive any further updates.
Features
FlowFuse Dashboard provides a base set of nodes for building your own user interfaces and data visualisations. Much like it's predecessor, it provides a set of easy-to-use, core nodes, but provides complete flexibility for customisation and control over theming, layout and behaviour if you want to go further.
Easy Integration
The nodes provided integrate seamlessly with any of the existing nodes and flows you have. Whatever you're trying to control or visualise, you can do it with Node-RED and FlowFuse Dashboard.
Data Visualization
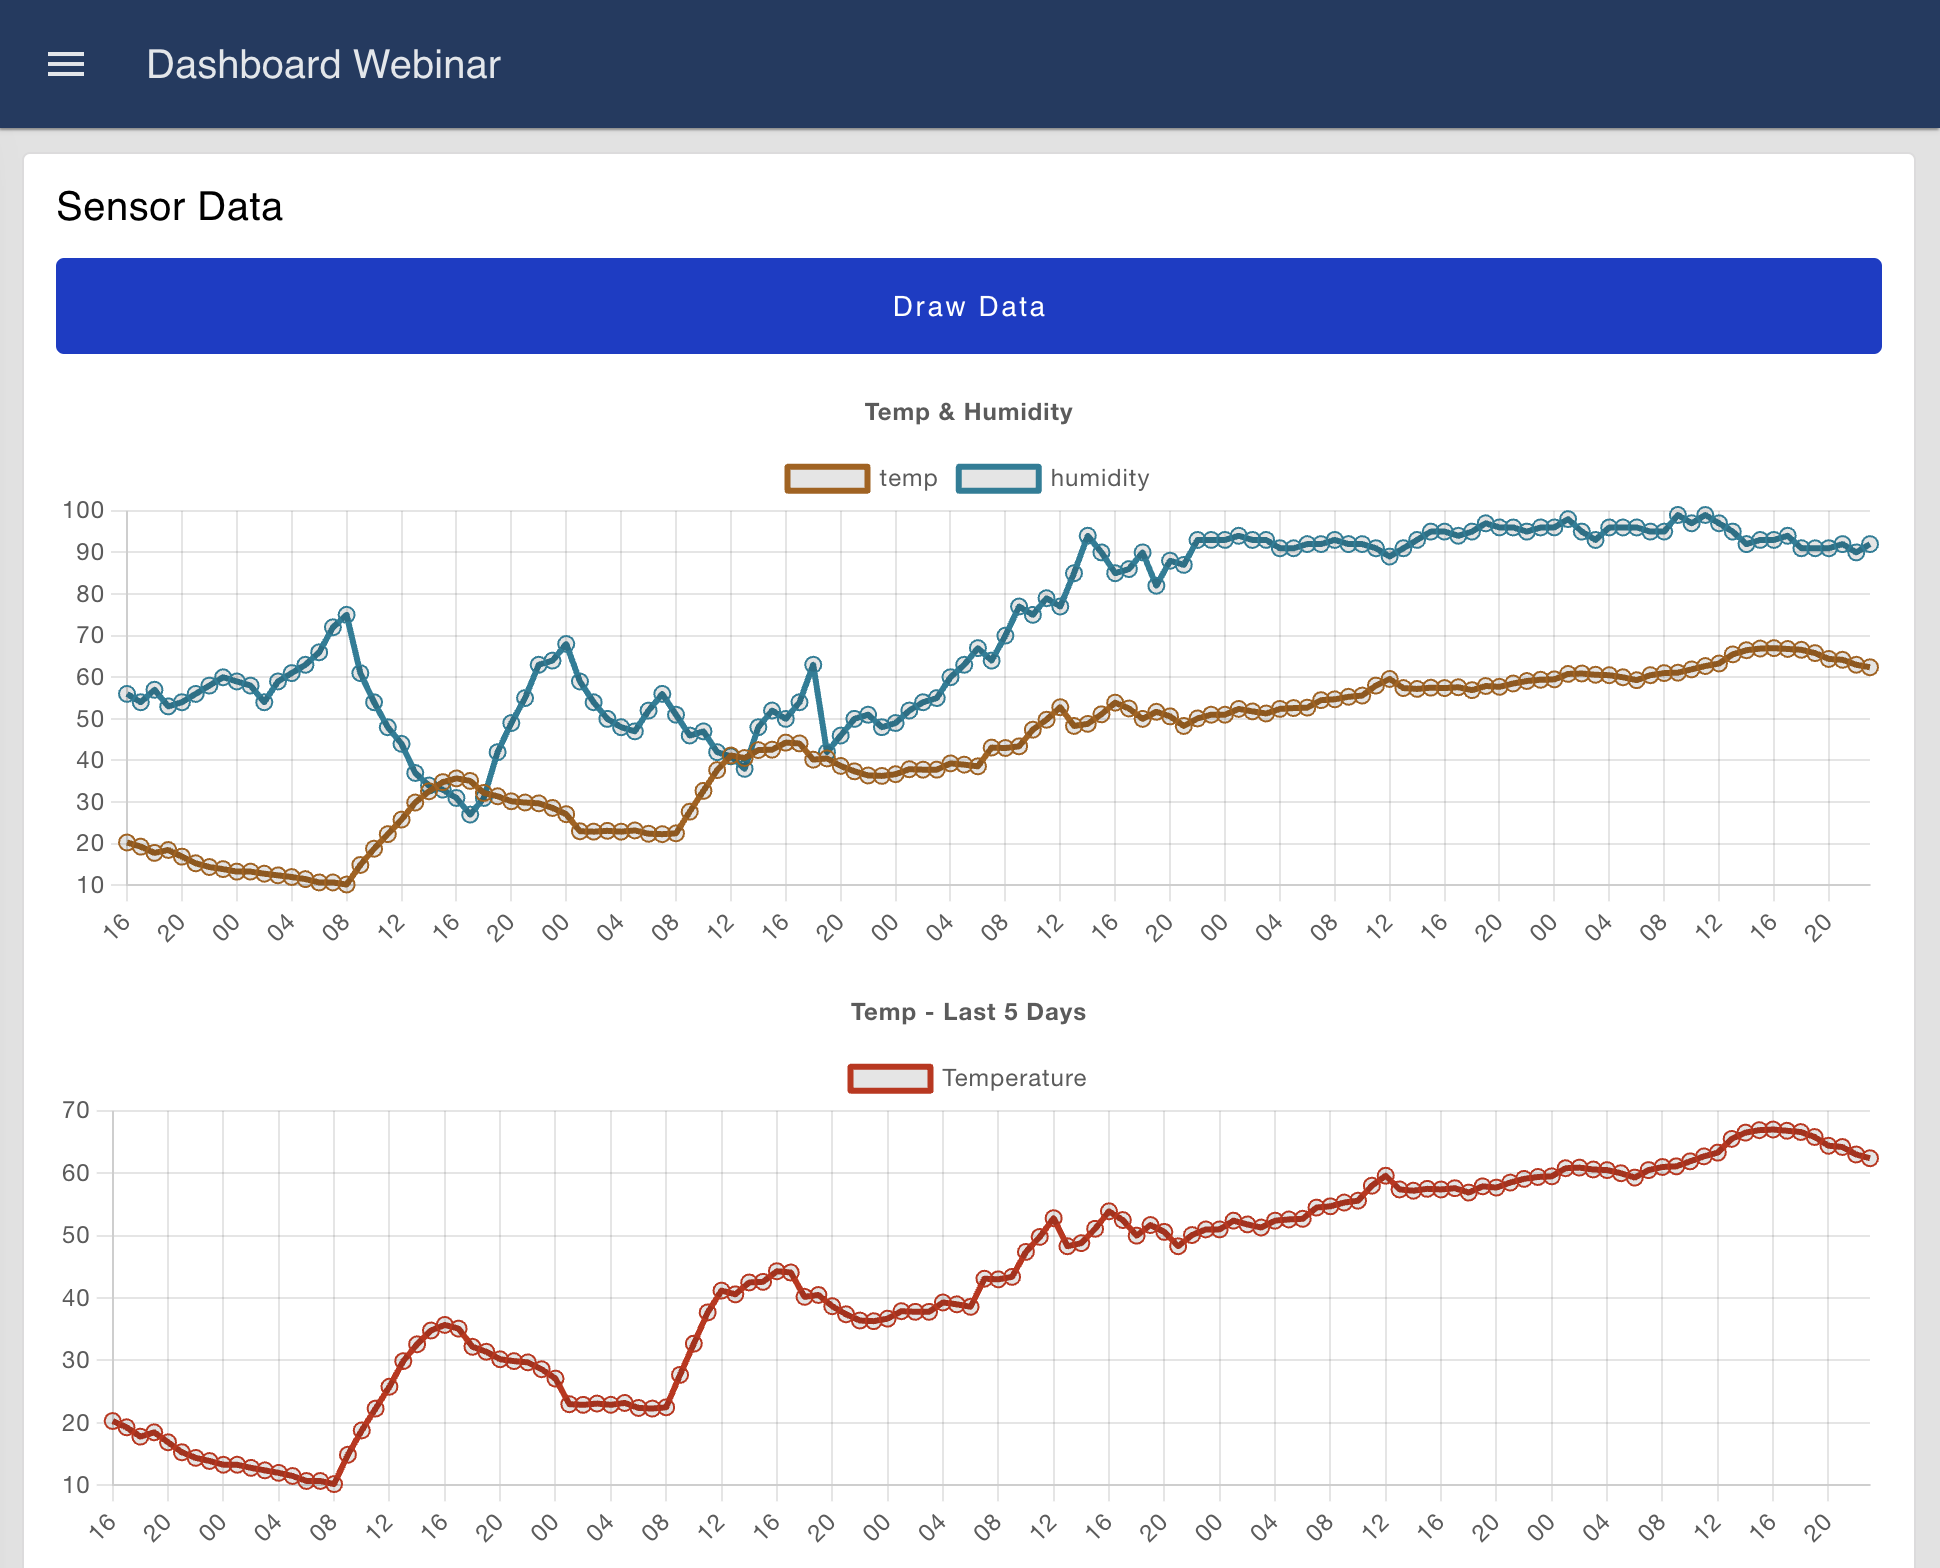
No dashboard is complete without data visualisation. FlowFuse Dashboard provides a core ui-chart widget to provide a simple, yet powerful way to visualise your data. It supports a wide range of chart types, including line, bar and scatter, with more planned for the near future.
Flexible Customisation
As with Node-RED Dashboard, the new FlowFuse Dashboard, comes with a ui-template node which allows you to define your own custom widgets and styling.
It provides a framework with which you can write raw HTML/JavaScript, define an entire Vue component to render something truly unique and interactive, and override any of the styling of the dashboard using your own custom CSS declarations.
If you're looking to build your own bespoke templates, checkout our useful UI Template Examples collection
Complete Control
ui-event and ui-control both allow rich insight into interactivity with your dashboard, as well as easy to use control over the dashboard itself, allowing you to dynamically hide and disable content, driven by any criteria of your choosing.
Build with Markdown & Mermaid
The new ui-markdown widget allows you to build rich, interactive applications using Markdown and Mermaid Charts. You can use Markdown templates to build your UI, and populate it with your own, dynamic data, and then use Mermaid to display dynamic charts and diagrams.
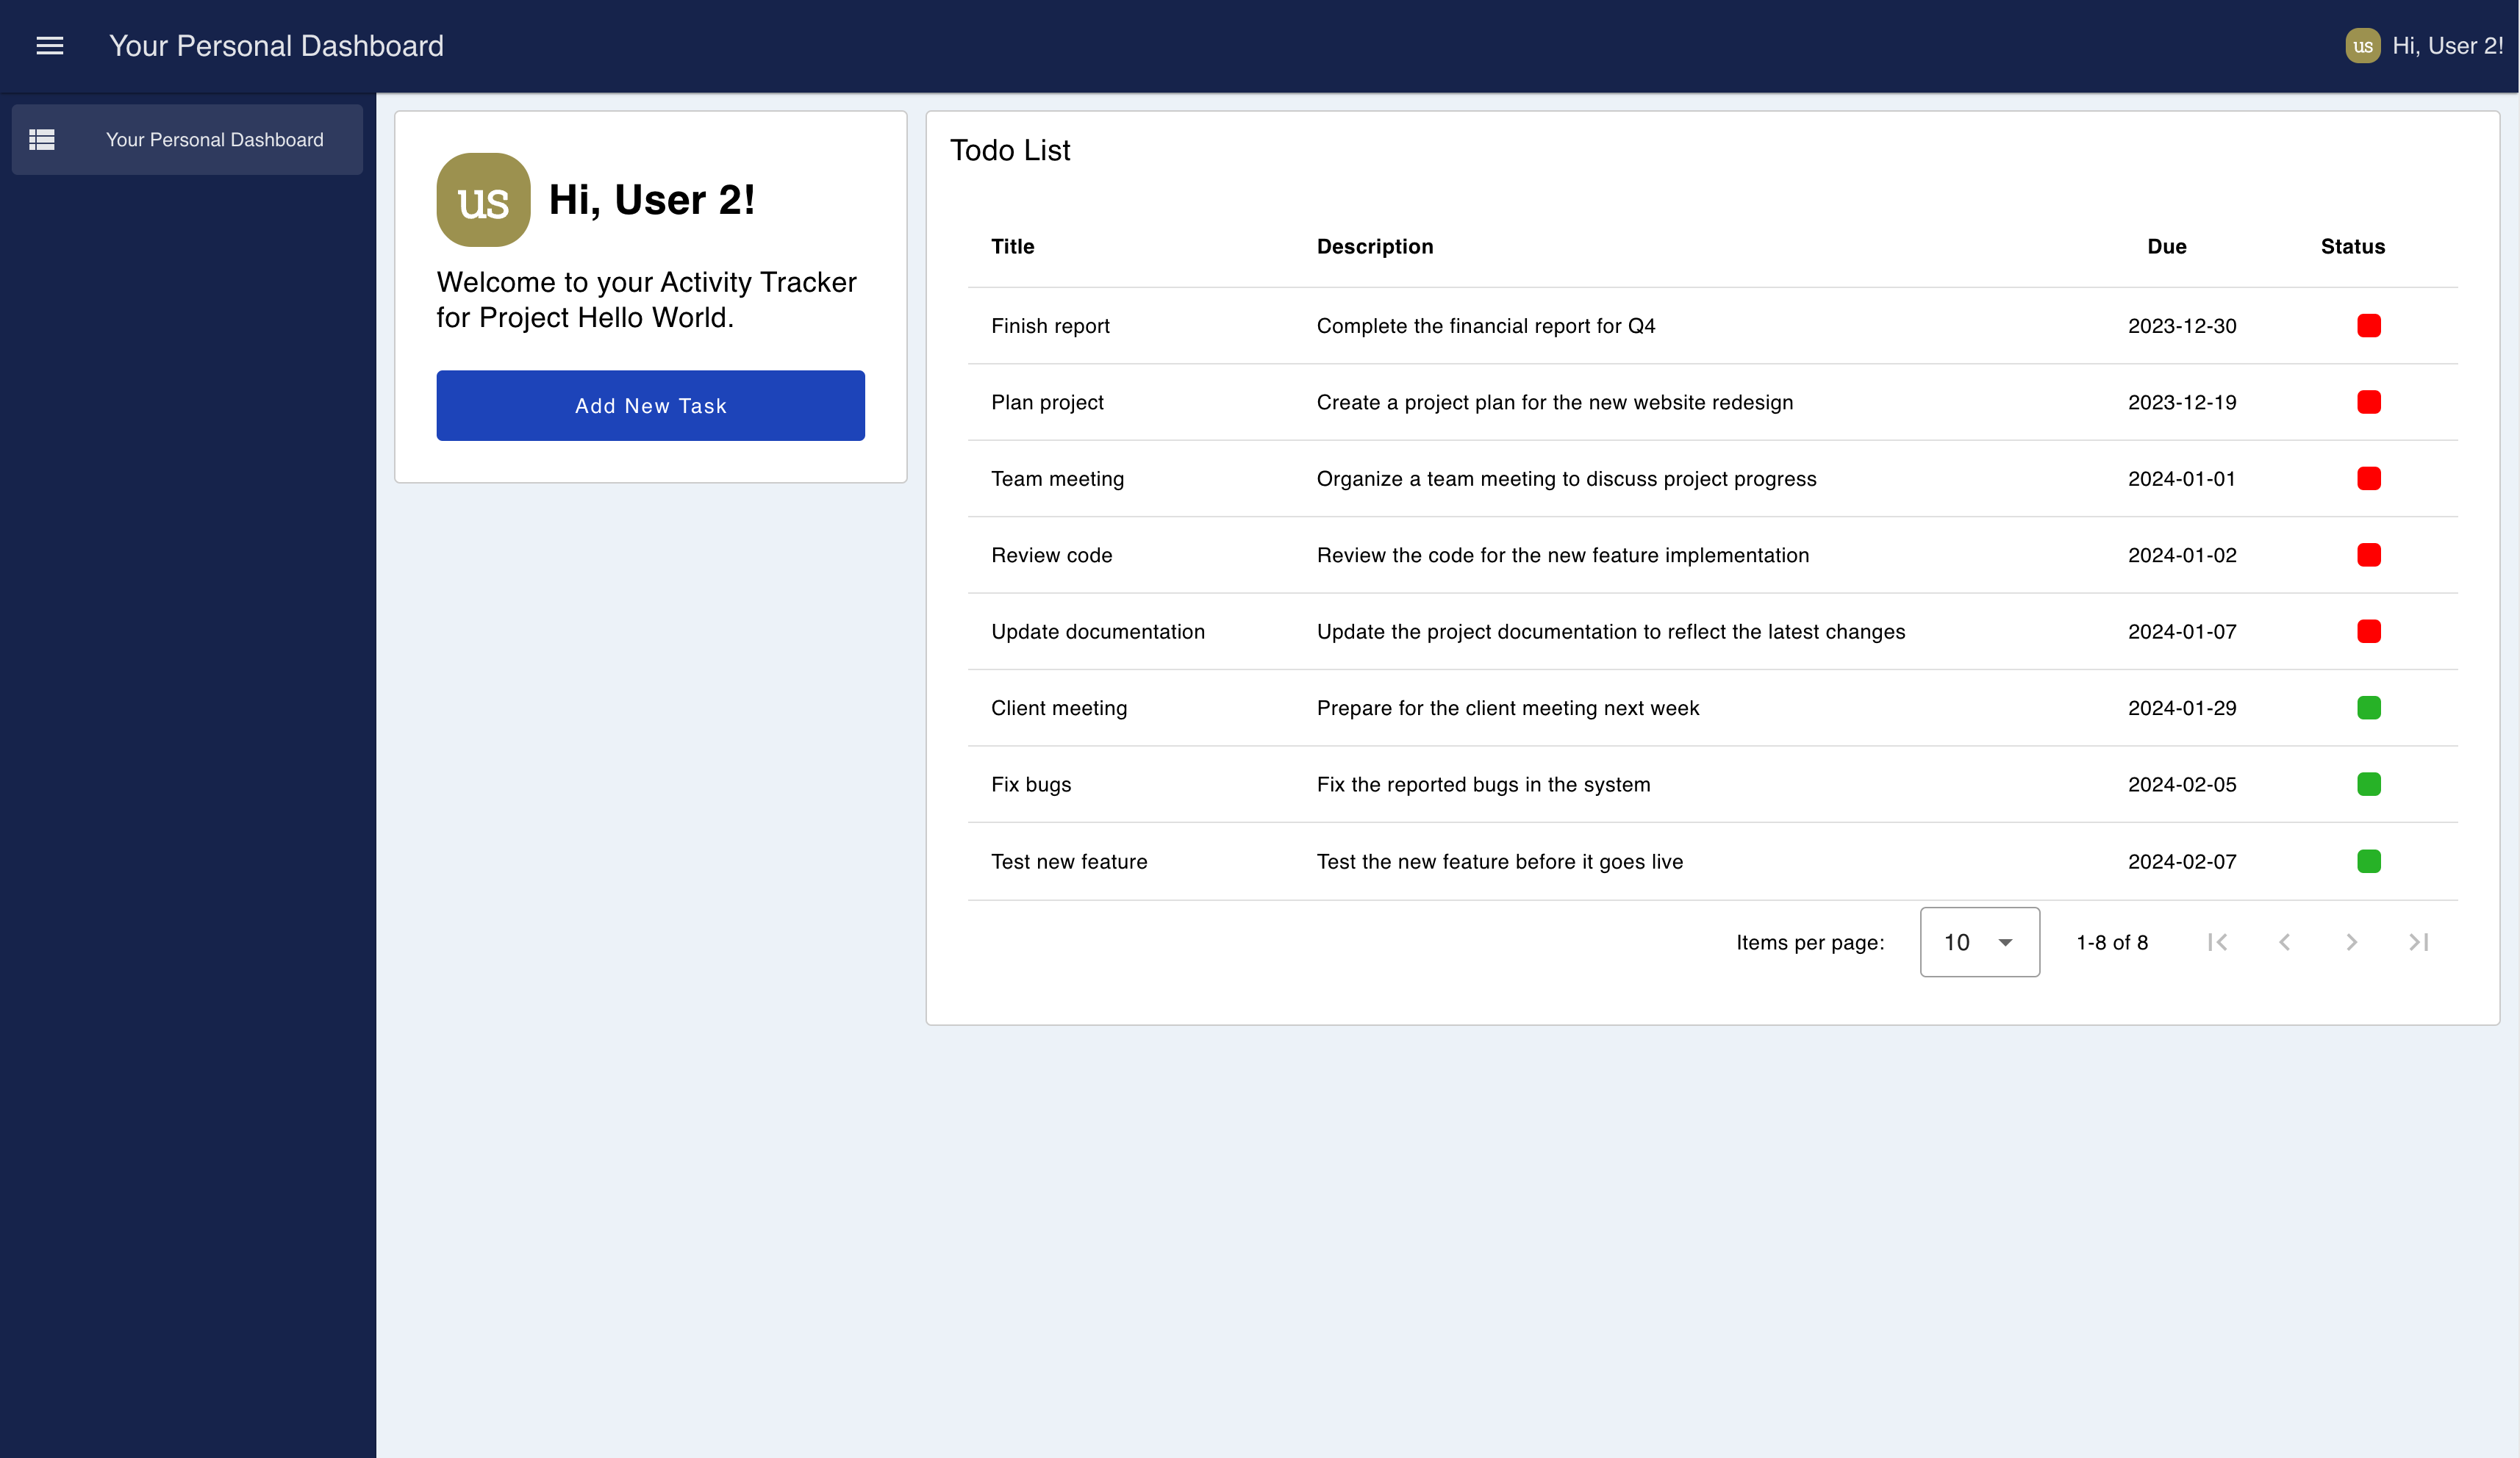
Project Planning
Community and Contribution
As an open-source project, FlowFuse Dashboard openly welcomes all forms of contributions, whether those are ideas, bug reports, or code contributions through Pull Requests.
We strongly believe in the power of community. If you have suggestions, feedback, or features you'd like to see, please open a GitHub issue. We also highly encourage open-source contributions.
Roadmap
We are constantly reviewing the priority of our backlog, and have multiple public project management boards where you can keep an eye on what we're working on, and what's coming up next:
- Activity Tracker: See what's being actively worked on, what's up next, and if there are any "Blocked" items you could help with.
- Node-RED Dashboard Feature Parity: We haven't quite yet achieved 100% feature parity with the original Node-RED Dashboard, and this board tracks the progress and priority of those features.
Motivation
The original Node-RED Dashboard has served us well for many years, providing an intuitive way to create live dashboards for Node-RED flows. However, the original Dashboard is based on Angular v1, which is no longer actively maintained. We identified the need for a secure, updated, and innovative successor.
FlowFuse Dashboard was re-built from the ground up, learning from the popular features and feedback of Node-RED Dashboard. It will carry the legacy forward, adapting to future needs while keeping the essence of open-source and community-driven development intact. The project will is licensed under Apache 2.0.
License
Apache License 2.0


