
Security News
MCP Community Begins Work on Official MCP Metaregistry
The MCP community is launching an official registry to standardize AI tool discovery and let agents dynamically find and install MCP servers.
By Sarah Gooding - May 09, 2025
@image-tracer-ts/core
Advanced tools
Convert image bitmaps into SVG by tracing outlines. Typescript version of imagetracerjs. Use imagetracerts-nodejs or imagetracerts-browser for platform-specific file input and output.
Trace images into SVG.
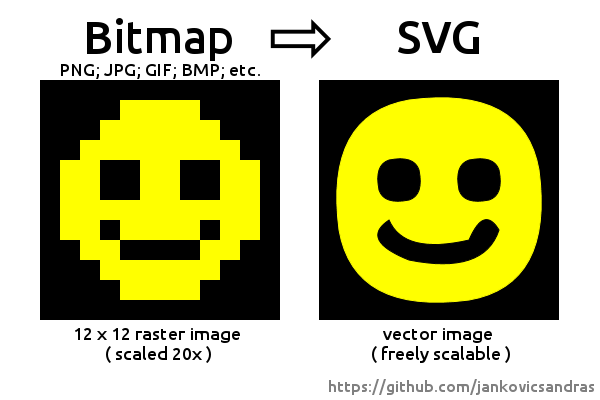
Typescript reimplementation of imagetracer-js.
Provides ESM and CJS packages.
The core package only works with ImageData, use @image-tracer-ts/browser or @image-tracer-ts/nodejs to trace different image formats (like PNG, JPEG, etc) from different sources (files, buffers, URLs, etc).
import { ImageTracer, Options } from '@image-tracer/core';
const options: Partial<Options> = {fillStyle: 'stroke'}
const tracer = new ImageTracer(options)
const svgString = tracer.traceImage(imageData, drawer)
Tracing happens in four steps, each comes with several configuration options. Pass them in a configuration object, or as command line parameter, prefixed with -- (i.e. --blurRadius 5).
Optional steps to adjust image before processing.
| Option | Type | Default | Description |
|---|---|---|---|
| blurRadius | number (between 0 and 5) | 0 (off) | Number of pixels (in each direction) to calculate the blurred pixel value from. |
| blurDelta | number (0 - 4*255) | 20 | Maximum allowed difference between original pixel and blurred pixel when summing up RGBA values. If a blurred pixel exceeds delta, the original pixel is used instead. |
| sharpen | boolean | false | Use sharpen filter |
| sharpenThreshold | number (0 - 4*255) | 20 | Maximum allowed difference between original pixel and sharpened pixel when summing up RGBA values. If a sharpened pixel exceeds threshold, the original pixel is used instead. |
Create a base palette and apply clustering to the pixels in the image to build color layer masks.
| Option | Type | Default | Description |
|---|---|---|---|
| colorSamplingMode | generate | sample | scan | palette | scan | Select how internal palette will be generated:
|
| palette | Array<{r:number, g:number, b:number, a?:number}> | null | Array of colors to use with colorSamplingMode=palette |
| numberOfColors | number | 16 | Number of colors to be generated. |
| colorClusteringCycles | number | 3 | Number of color clustering cycles. |
| colorDistanceBuffering | off | on | reasonable | reasonable | Buffers color distances during clustering. Very efficient if palette has more than 30 colors. |
| minColorQuota | number (between 0 and 1) | 0 (off) | Threshold for color pruning during color clustering. If ratio between pixels of a color and all pixels is below the given number, the color will be replaced by a random color. |
Create vector data from pixels.
| Option | Type | Default | Description |
|---|---|---|---|
| minShapeOutline | number | 0 (off) | Discard traced areas with an outline of less than the given number of points. |
| interpolation | off | interpolate | interpolate | Sets interpolation mode. |
| enhanceRightAngles | boolean | true | Do not interpolate right angles. |
| lineErrorMargin | number | 1 | Line tracer error margin. Gives the squared maximum distance a point can be off a line trajectory to be still put on it. |
| curveErrorMargin | number | 1 | Curve tracer error margin. Gives the squared maximum distance a point can be off a curved trajectory to be put on it. |
Create SVG data from vectors.
| Option | Type | Default | Description |
|---|---|---|---|
| fillStyle | fill | stroke | stroke+fill | stroke+fill | Select how color segments are colored. |
| strokeWidth | number | 1 | Stroke width written to SVG path. |
| scale | number | 1 | Multiply all coordinates by this number. |
| decimalPlaces | number | 1 | Number of decimal places in svg values. |
| viewBox | boolean | true | If enabled, the viewBox attribute will be set on the SVG tag element. |
| trim | off | ratio | all | off | Removes empty border from the image. |
| lineFilter | boolean | false | Do not draw lines (areas with less than 3 points). |
| desc | boolean | false | Write a desc attribute to SVG edges with debug output |
| segmentEndpointRadius | number | 0 (off) | Enables control output, draws white dots with given radius at segment borders. |
| curveControlPointRadius | number | 0 (off) | Enables control output, draws curve control points as cyan dots with given radius. |
| Option | Type | Default | Description |
|---|---|---|---|
| verbose | boolean | false | Write status data to console during trace. |
| out | string | input file name + .svg | Set output file name (in ImageTracerNodejs) |
| preset | see preset names below | null | Use preset from command line |
Preset configurations can be imported from the Options object:
import { Options } from '@image-tracer/core';
ImageTracerBrowser.fromUrl<OutputType = string>(url, Options.Presets.posterized1)
From command line, the --preset parameter can be used along with a preset name:
defaultposterized1 posterized2 posterized3curvysharpdetailedsmoothedgrayscalefixedpaletterandomsampling1 randomsampling2artistic1 artistic2 artistic3 artistic4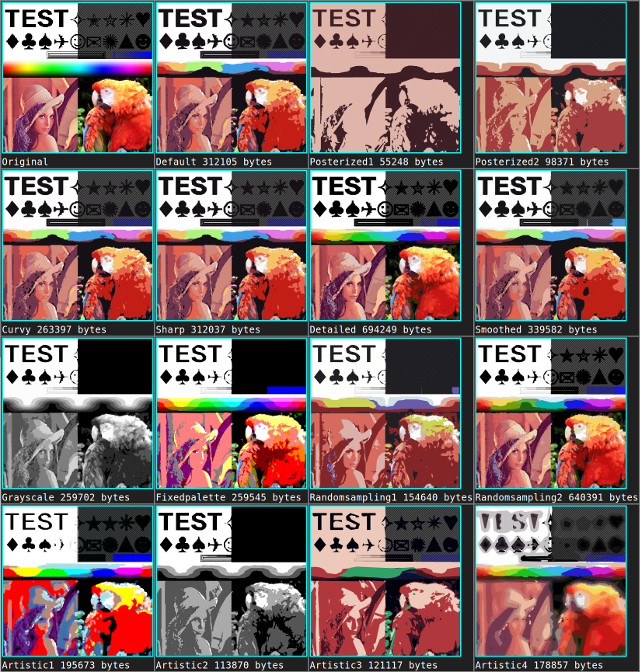
You can provide a custom ImageDrawer to change how output is created from traced data:
const drawer = new CustomizedImageDrawer()
const svgString = new ImageTracer(options).traceImage(imageData, drawer)
FAQs
Convert image bitmaps into SVG by tracing outlines. Typescript version of imagetracerjs. Use imagetracerts-nodejs or imagetracerts-browser for platform-specific file input and output.
The npm package @image-tracer-ts/core receives a total of 28 weekly downloads. As such, @image-tracer-ts/core popularity was classified as not popular.
We found that @image-tracer-ts/core demonstrated a not healthy version release cadence and project activity because the last version was released a year ago. It has 1 open source maintainer collaborating on the project.
Did you know?

Socket for GitHub automatically highlights issues in each pull request and monitors the health of all your open source dependencies. Discover the contents of your packages and block harmful activity before you install or update your dependencies.
Security News
The MCP community is launching an official registry to standardize AI tool discovery and let agents dynamically find and install MCP servers.

Research
Security News
Socket uncovers an npm Trojan stealing crypto wallets and BullX credentials via obfuscated code and Telegram exfiltration.

Research
Security News
Malicious npm packages posing as developer tools target macOS Cursor IDE users, stealing credentials and modifying files to gain persistent backdoor access.