Security News
Crates.io Implements Trusted Publishing Support
Crates.io adds Trusted Publishing support, enabling secure GitHub Actions-based crate releases without long-lived API tokens.
By Sarah Gooding - Jul 16, 2025
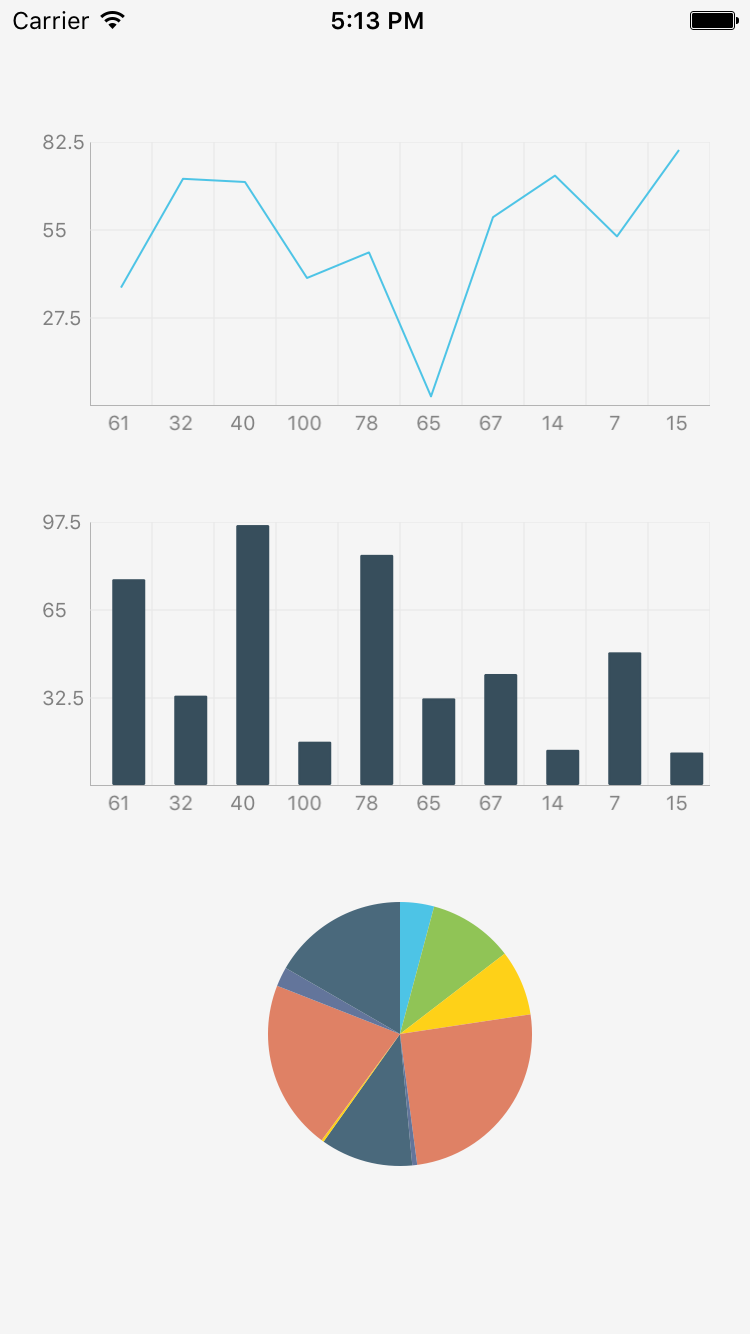
@jemmyphan/react-native-chart
Advanced tools
[](https://gitter.im/tomauty/react-native-chart) [](https://badge.fury.
npm i react-native-chart --saveLink ART to your project


4 Click the '+', and add libART.a

Then rebuild.
import React, { StyleSheet, View, Component } from 'react-native';
import Chart from 'react-native-chart';

const styles = StyleSheet.create({
	container: {
		flex: 1,
		justifyContent: 'center',
		alignItems: 'center',
		backgroundColor: 'white',
	},
	chart: {
		width: 200,
		height: 200,
	},
});

const data = [[
	[0, 1],
	[1, 3],
	[3, 7],
	[4, 9],
]];

class SimpleChart extends Component {
	render() {
		return (
			<View style={styles.container}>
				<Chart
					style={styles.chart}
					data={data}
					verticalGridStep={5}
					type="line"
					showDataPoint={true}
					color={['#e1cd00']}
				 />
			</View>
		);
	}
}
Use '' y-values to signify the 'render but empty' data points.
| Property | Type | Description | Required | Default |
|---|---|---|---|---|
| data | Array< Array< [number, number] > > | An array of arrays of [x, y] pairs. | Yes | |
| type | string | pie/bar/line | Yes | bar |
| color | Array < string > | Color of bars/line in line chart | No | #4DC4E6 |
| cornerRadius | number | Corner radius of bars in bar chart | No | 0 |
| fillColor | Array < string > | Fill area colors in line chart | No | |
| dataPointColor | Array < string > | Stroke colors for line chart data point | No | |
| dataPointFillColor | Array < string > | Fill colors for line chart data point | No | |
| dataPointRadius | number | Radius of the data point | No | 3 |
| lineWidth | number | Width of line chart line | No | 1 |
| showDataPoint | boolean | Show data points on line chart | No | false |
| sliceColors | Array < string > | Array of colors for pie chart slices | Yes | [ < random colors > ] |
| axisColor | string | Color of axis lines | No | #333333 |
| axisLabelColor | string | Color of axis test | No | #333333 |
| axisLineWidth | number | Width of axis lines | No | 1 |
| gridColor | string | Color of grid lines | No | #333333 |
| gridLineWidth | number | Width of grid lines | No | 0.5 |
| hideHorizontalGridLines | boolean | Hide grid lines going from LTR | No | false |
| hideVerticalGridLines | boolean | Hide grid lines going up -> down | No | false |
| showAxis | boolean | Show the X and Y axes | No | true |
| showGrid | boolean | Show the grid | No | true |
| showXAxisLabels | boolean | Show X-Axis labels | No | true |
| showYAxisLabels | boolean | Show Y-Axis labels | No | true |
| style | object | Style on the container | No | {} |
| tightBounds | boolean | Tighten min and max bounds strictly to min/max in dataset | No | false |
| verticalGridStep | number | How many vertical grid lines to show | No | 4 |
| horizontalGridStep | number | How many horizontal grid lines to show | No | all |
| xAxisHeight | number | Height of X-axis container | No | 20 |
| yAxisTransform | Function | Transform data point to y-axis label | No | (_) => _ |
| xAxisTransform | Function | Transform data point to x-axis label | No | (_) => _ |
| yAxisWidth | number | Width of the Y-axis container | No | 30 |
| yAxisUseDecimal | boolean | Show decimals on Y-axis labels | No | false |
| yAxisShortLabel | boolean | Shorten yAxis labels with K, M, B for thousand<->billion, etc | No | false |
Work prior to repo transfer on Feb 1, 2015 was the work of Hyun Cho @ OneFold.
Email tom.auty@gmail.com for support.
FAQs
[](https://gitter.im/tomauty/react-native-chart) [](https://badge.fury.
The npm package @jemmyphan/react-native-chart receives a total of 1 weekly downloads. As such, @jemmyphan/react-native-chart popularity was classified as not popular.
We found that @jemmyphan/react-native-chart demonstrated a not healthy version release cadence and project activity because the last version was released a year ago. It has 2 open source maintainers collaborating on the project.
Did you know?

Socket for GitHub automatically highlights issues in each pull request and monitors the health of all your open source dependencies. Discover the contents of your packages and block harmful activity before you install or update your dependencies.
Security News
Crates.io adds Trusted Publishing support, enabling secure GitHub Actions-based crate releases without long-lived API tokens.
Research
/Security News
Undocumented protestware found in 28 npm packages disrupts UI for Russian-language users visiting Russian and Belarusian domains.

Research
/Security News
North Korean threat actors deploy 67 malicious npm packages using the newly discovered XORIndex malware loader.