Research
Security News
Lazarus Strikes npm Again with New Wave of Malicious Packages
The Socket Research Team has discovered six new malicious npm packages linked to North Korea’s Lazarus Group, designed to steal credentials and deploy backdoors.
@joakimono/echarts-extension-leaflet
Advanced tools
Leaflet extension for Apache ECharts
This is a Leaflet extension for [[https://echarts.apache.org/en/index.html][Apache ECharts]], which is used to display visualizations such as [[https://echarts.apache.org/en/option.html#series-scatter][Scatter]], [[https://echarts.apache.org/en/option.html#series-lines][Lines]], [[https://echarts.apache.org/en/option.html#series-heatmap][Heatmap]], and [[https://echarts.apache.org/en/option.html#series-pie][Pie]] charts. Supports ECharts >= 5.0.1.
This work is based on
** Installation
#+begin_src shell npm install @joakimono/echarts-extension-leaflet --save #+end_src
** Notes
** Usage
*** Import Import using vanilla javascript or through a bundler like =webpack= using =require= or =import=.
The built script =echarts-extension-leaflet.js= is available on CDN and can be used in combination with Leaflet and ECharts scripts as follows.
Make sure to load Leaflet and ECharts before the extension. #+begin_src html #+end_src
The script may be used with CommonJS and ESM. Note: Currently, only ESM has been tested. #+begin_src js // use require require('leaflet'); require('echarts'); require('echarts-extension-leaflet');
// use import
import * from 'leaflet';
import * as echarts from 'echarts';
import 'echarts-extension-leaflet';
#+end_src
*** Import on demand
Apache ECharts has provided us the [[https://echarts.apache.org/en/tutorial.html#Use%20ECharts%20with%20bundler%20and%20NPM][new tree-shaking]] since v5.0.1. This is how to use
it in this extension:

#+begin_src js
  // import scatter, effectScatter and lmap extension component on demand
  import { use, init, ComposeOption } from 'echarts/core';

  import {
    ScatterChart,
    ScatterSeriesOption,
    EffectScatterChart,
    EffectScatterSeriesOption
  } from 'echarts/charts';

  import {
    TooltipComponent,
    TitleComponentOption
  } from 'echarts/components';

  import { CanvasRenderer } from 'echarts/renderers';

  import {
    LeafletComponent,
    LeafletComponentOption
  } from '@joakimono/echarts-extension-leaflet/src/export';

  import 'leaflet/dist/leaflet.css';
  import { MapOptions } from 'leaflet';

  // compose required options
  type ECOption = ComposeOption<
    | ScatterSeriesOption
    | EffectScatterSeriesOption
    | TitleComponentOption
    // unite LeafletComponentOption with the initial options of Leaflet `L.MapOptions`
  > & LeafletComponentOption<MapOptions>;

  // register renderers, components and charts
  use([
    CanvasRenderer,
    TooltipComponent,
    LeafletComponent,
    ScatterChart,
    EffectScatterChart
  ]);

  // define ECharts option
  const option: ECOption = {
    // Leaflet extension option
    lmap: {
      // ...
    },
    title: {
      // ...
    },
    series: [
      {
        type: 'scatter',
        // Use Leaflet coordinate system
        coordinateSystem: 'lmap',
        // ...
      }
    ]
    // ...
  };
#+end_src
*** Example
The code listings below show excerpts on using ECharts scatter chart together with a Leaflet map.
The important bits are:
+ The =div= container for the map must have nonzero width and height
+ The Leaflet stylesheet must be imported
+ Set the EChart options before retrieving the Leaflet instance from the extension.
+ See the =examples/typescript= for a full example
#+begin_src html
...
<style type="text/css">
,* {
margin: 0;
padding: 0;
}
html,
body,
#echarts-lmap {
width: 100%;
height: 100%;
overflow: hidden;
}
</style>
</head>
<body>
<div id="echarts-lmap"/>
#+end_src
#+begin_src js
import "leaflet/dist/leaflet.css";
import {tileLayer as LtileLayer } from 'leaflet'; // If you import Leaflet on demand
const option = {
lmap: {
// See https://leafletjs.com/reference.html#map-option for details
// NOTE: note that this order is reversed from Leaflet's [lat, lng]!
center: [10, 60], // [lng, lat]
zoom: 4,
resizeEnable: true, // automatically handles browser window resize.
// whether echarts layer should be rendered when the map is moving. Default is true.
// if false, it will only be re-rendered after the map `moveend`.
// It's better to set this option to false if data is large.
renderOnMoving: true,
echartsLayerInteractive: true, // Default: true
largeMode: false // Default: false
// Note: Please DO NOT use the initial option `layers` to add Satellite/RoadNet/Other layers now.
},
series: [
{
type: 'scatter',
// use `lmap` as the coordinate system
coordinateSystem: 'lmap',
// data items [[lng, lat, value], [lng, lat, value], ...]
data: [[120, 30, 8], [120.1, 20, 3]],
encode: {
// encode the third element of data item as the `value` dimension
value: 2
}
}
]
};
// initialize echart
var chart = init(document.getElementById("echarts-lmap"));
chart.setOption(option);
// Get Leaflet extension component
// getModel and getComponent do not seem to be exported in echarts typescript
// add the following two comments to circumvent this
// eslint-disable-next-line @typescript-eslint/ban-ts-comment
// @ts-ignore
const lmapComponent = chart.getModel().getComponent('lmap');
// Get the instance of Leaflet
// eslint-disable-next-line @typescript-eslint/ban-ts-comment
// @ts-ignore
const lmap = lmapComponent.getLeaflet();
LtileLayer(
"https://server.arcgisonline.com/ArcGIS/rest/services/World_Topo_Map/MapServer/tile/{z}/{y}/{x}",
{
attribution:
"Tiles © Esri — Esri, DeLorme, NAVTEQ, TomTom, Intermap, iPC, USGS, FAO, NPS, NRCAN, GeoBase, Kadaster NL, Ordnance Survey, Esri Japan, METI, Esri China (Hong Kong), and the GIS User Community",
}
).addTo(lmap);
#+end_src
FAQs
Leaflet map extension for Apache Echarts 5
We found that @joakimono/echarts-extension-leaflet demonstrated a healthy version release cadence and project activity because the last version was released less than a year ago. It has 0 open source maintainers collaborating on the project.
Did you know?

Socket for GitHub automatically highlights issues in each pull request and monitors the health of all your open source dependencies. Discover the contents of your packages and block harmful activity before you install or update your dependencies.

Research
Security News
The Socket Research Team has discovered six new malicious npm packages linked to North Korea’s Lazarus Group, designed to steal credentials and deploy backdoors.

Security News
Socket CEO Feross Aboukhadijeh discusses the open web, open source security, and how Socket tackles software supply chain attacks on The Pair Program podcast.

Security News
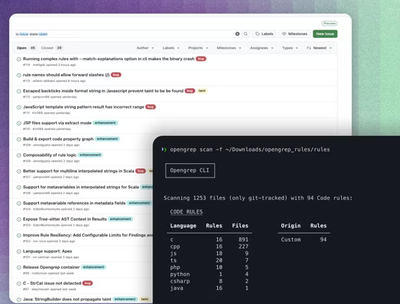
Opengrep continues building momentum with the alpha release of its Playground tool, demonstrating the project's rapid evolution just two months after its initial launch.