Product
Introducing Socket Scanning for OpenVSX Extensions
Socket now scans OpenVSX extensions, giving teams early detection of risky behaviors, hidden capabilities, and supply chain threats in developer tools.
@marioslab/buckety-buckeroo
Advanced tools
Got streaming data and want to create an approximate histogram for it? Want to also render the bins to a canvas without bells and whistles? That's what buckety-buckeroo does for you.
The implementation is based on the paper Streaming Parallel Decision Trees.

You can include buckety-buckeroo directly on your page via.
<script src="https://cdn.jsdelivr.net/npm/@marioslab/buckety-buckeroo@1.0.0/dist/iife/buckety-buckero.min.js">
Every function and "class" is exposed on the global buckety object.
If you manage your project dependencies with NPM, add buckety-buckeroo as follows:
npm install @marioslab/buckety-buckeroo
Then import all exported functions and classes in your source files via:
import * as buckety from "@marioslab/buckety-buckeroo"
Create a histogram and specify the number of buckets it should have:
let histogram = new buckety.Histogram(100);
Then add values:
histrogram.addValue(432.32);
histrogram.addValue(-0.21);
histrogram.addValue(64);
You can calculate approximate quantiles:
let tenPercentQuantile = histogram.quartile(0.1);
Or perform your own calculation by iterating the buckets:
let mean = 0;
for (let bucket of histogram.buckets) {
	mean += bucket.value;
}
mean /= histogram.buckets.length;
Finally, you can draw the histogram to a canvas.
<canvas></canvas>
<script>
	let canvas document.querySelector("canvas");
	let histogram = new buckety.Histogram(20);
	let histogramChart = new buckety.HistrogramChart(canvas, { histrogram: histogram });
	histrogramChart.render();
</script>
See the demo above for an interactive example.
No, but I might accept pull requests.
Install Git, Node.js, and Visual Studio Code. Then:
git clone https://github.com/badlogic/buckety-buckeroo
cd buckety-buckeroo
npm run dev
code.
Press F5, modify code, press CTRL+S, see the page auto-update with your changes, set some breakpoints.
FAQs
Streaming histogram library.
We found that @marioslab/buckety-buckeroo demonstrated a not healthy version release cadence and project activity because the last version was released a year ago. It has 1 open source maintainer collaborating on the project.
Did you know?

Socket for GitHub automatically highlights issues in each pull request and monitors the health of all your open source dependencies. Discover the contents of your packages and block harmful activity before you install or update your dependencies.

Product
Socket now scans OpenVSX extensions, giving teams early detection of risky behaviors, hidden capabilities, and supply chain threats in developer tools.

Product
Bringing supply chain security to the next generation of JavaScript package managers

Product
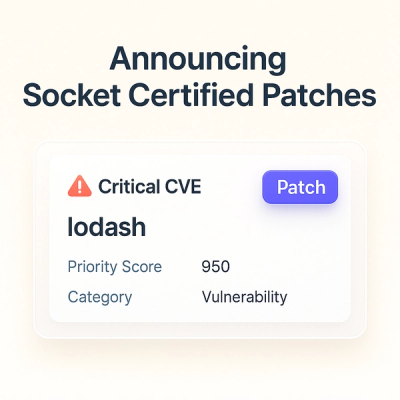
A safer, faster way to eliminate vulnerabilities without updating dependencies