@openassistant/plots
The plot tools for OpenAssistant provides powerful visualization capabilities using Vega-Lite and Apache ECharts.
Features
| vegaLitePlot | create a Vega-Lite plot, e.g. bar chart, line chart, scatter plot, etc. from a dataset. The vega-lite plots are listed here. |
| Interactive Plots | create a eCharts plot that can be interactive with other components e.g. map, table, etc. |
| histogram | create a histogram plot from a dataset |
| scatterplot | create a scatter plot from a dataset |
| pcp | create a parallel coordinates plot from a dataset |
| boxplot | create a box plot from a dataset |
| bubbleChart | create a bubble chart from a dataset |
Installation
npm install @openassistant/plots @openassistant/utils ai
Quick Start
Suppose you have a dataset which could be fetched from your data API. The json data could look like this:
const SAMPLE_DATASETS = {
  myVenues: [
    { "location": "New York", "latitude": 40.7128, "longitude": -74.0060, "revenue": 12500000, "population": 8400000 },
    ...
  ]
};
Share the meta data of your dataset in the system prompt, so the LLM can understand which datasets are available to use when creating a plot.
:::note
The meta data is good enough for the AI assistant. Don't put the entire dataset in the context, and there is no need to share your dataset with the LLM models. This also helps to keep your dataset private.
:::
const systemPrompt = `You can help users to create a map from a dataset.
Please always confirm the function calling and its arguments with the user.

Here is the dataset are available for function calling:
DatasetName: myVenues
Fields: location, longitude, latitude, revenue, population`;
You can use the vegaLitePlot tool to create a Vega-Lite plot from a dataset.
import { vegaLitePlot, VegaLitePlotTool } from '@openassistant/plots';
import { convertToVercelAiTool } from '@openassistant/utils';
import { generateText } from 'ai';
const vegaLitePlotTool: VegaLitePlotTool = {
...vegaLitePlot,
context: {
getValues: async (datasetName, variableName) => {
return SAMPLE_DATASETS[datasetName].map((item) => item[variableName]);
},
},
onToolCompleted: (toolCallId, additionalData) => {
console.log('Tool call completed:', toolCallId, additionalData);
},
};
generateText({
model: openai('gpt-4.1', { apiKey: key }),
system: systemPrompt,
prompt:
'Can you create a bar chart of the population for each location in dataset myVenues?',
tools: {
vegaLitePlot: convertToVercelAiTool(vegaLitePlotTool),
},
});
Interactive Plots Example
Here is an example of using AiAssistant to create eCharts plots that can be interactive with other components e.g. map, table, etc.
Install the dependencies:
npm install @openassistant/plots @openassistant/ui @openassistant/echarts
Then, you can use the AiAssistant component to create the plots.
import {
histogram,
HistogramTool,
scatterplot,
ScatterplotTool,
} from '@openassistant/plots';
import {
HistogramComponent,
ScatterplotComponent,
} from '@openassistant/echarts';
import { Assistant, type AssistantOptions } from '@openassistant/assistant';
const histogramTool: HistogramTool = {
...histogram,
context: {
getValues: (datasetName, variableName) => {
return SAMPLE_DATASETS[datasetName][variableName];
},
onSelected: (datasetName, selectedIndices) => {
console.log('Selected indices:', selectedIndices);
},
},
component: HistogramComponent,
};
const scatterplotTool: ScatterplotTool = {
...scatterplot,
context: {
getValues: (datasetName, variableName) => {
return SAMPLE_DATASETS[datasetName][variableName];
},
onSelected: (datasetName, selectedIndices) => {
console.log('Selected indices:', selectedIndices);
},
},
component: ScatterplotComponent,
};
const config: AssistantOptions = {
ai: {
getInstructions: () => 'You are a helpful assistant.',
tools: {
histogram: histogramTool,
scatterplot: scatterplotTool,
},
},
};
export function App() {
return (
<div className="flex h-screen w-screen items-center justify-center p-4">
<div className="w-full max-w-[900px] h-full">
<Assistant options={config} />
</div>
</div>
);
}
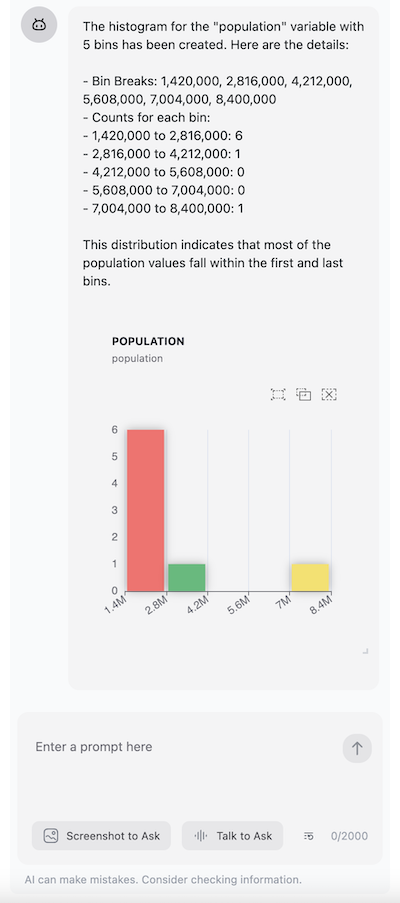
Once set up, you can create histograms through natural language prompts:
- For histograms: "Create a histogram of the 'revenue' variable"
- For scatter plots: "Show me a scatter plot of revenue vs population"
The assistant will automatically understand your request and use the appropriate visualization function.
Using TailwindCSS, make sure to include the package's CSS in your project:
import { sqlroomsTailwindPreset } from '@sqlrooms/ui';

const preset = sqlroomsTailwindPreset();
const config = {
  ...preset,
  content: [
    'src/**/*.{ts,tsx}',
    './node_modules/@openassistant/echarts/dist/**/*.{js,ts,jsx,tsx}',
    '../../node_modules/@sqlrooms/*/dist/**/*.js'
  ],
  theme: {
    ...preset.theme,
    extend: {
      ...preset.theme?.extend,
    },
  },
};

export default config;


