
Product
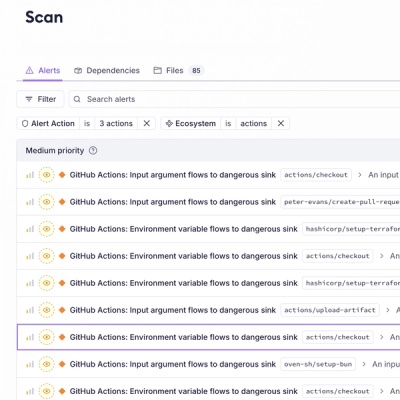
Introducing GitHub Actions Scanning Support
Detect malware, unsafe data flows, and license issues in GitHub Actions with Socket’s new workflow scanning support.
By Rakesh Chatrath, Greg Tystahl - Oct 23, 2025
@openmeteo/mapbox-layer
Advanced tools
Protocol to read OMfiles and parse them to tiles for Mapbox / Maplibre
![]()

⚠️ Notice This package is still under construction and is not yet fully production‑ready. API changes may occur and some features might be incomplete.
This repository demonstrates how to use the Open‑Meteo File Protocol (.om) with Mapbox / MapLibre GL JS.
The .om files are hosted on an S3 bucket and can be accessed directly via the om protocol:
The actual weather API implementation lives in the open‑meteo/open‑meteo repository.
An interactive demo is available at maps.open‑meteo.com.
npm install @openmeteo/mapbox-layer
...
import { omProtocol } from '@openmeteo/mapbox-layer';

// standard mapbox / maplibre setup
...

maplibregl.addProtocol('om', omProtocol);

const omUrl = `https://map-tiles.open-meteo.com/data_spatial/dwd_icon/2025/10/15/1200Z/2025-10-15T1400.om?variable=temperature_2m`;

map.on('load', () => {
	map.addSource('omFileSource', {
		url: 'om://' + omUrl,
		type: 'raster',
		tileSize: 256,
		maxzoom: 12 // tiles look pretty much the same below zoom-level 12, even on the high res models
	});

	map.addLayer({
		id: 'omFileLayer',
		type: 'raster',
		source: 'omFileSource'
	});
});
For a standalone example, see examples/temperature.html.
...
<script src="https://unpkg.com/@openmeteo/mapbox-layer@0.0.3/dist/index.js"></script>
...

<script>
	// Standard Mapbox / MapLibre GL JS setup
	// ...

	maplibregl.addProtocol('om', omProtocol);

	const omUrl = `https://map-tiles.open-meteo.com/data_spatial/dwd_icon/2025/10/15/1200Z/2025-10-15T1400.om?variable=temperature_2m`;

	map.on('load', () => {
		map.addSource('omFileSource', {
			url: 'om://' + omUrl,
			type: 'raster',
			tileSize: 256,
			maxzoom: 12 // tiles look pretty much the same below zoom-level 12, even on the high res models
		});

		map.addLayer({
			id: 'omFileLayer',
			type: 'raster',
			source: 'omFileSource'
		});
	});
</script>
The repository contains an examples directory with ready‑to‑run demos:
examples/temperature.html – shows temperature data from an OM file.examples/precipitation.html – displays precipitation using a similar setup.examples/custom-colorscale.html – shows how to use your own color definition.Run the examples by opening the corresponding .html file in a browser.
For contouring a new source must be added, since the contouring functionality uses vector tiles.
...

map.on('load', () => {
	map.addSource('omFileVectorSource', {
		url: 'om://' + omUrl,
		type: 'vector'
	});

	map.addLayer({
		id: 'omFileVectorLayer',
		type: 'line',
		source: 'omFileVectorSource',
		'source-layer': 'contours',
		paint: {
			'line-color': 'black',
			'line-width': 4
		}
	});
});
FAQs
Protocol to read OMfiles and parse them to tiles for Mapbox / Maplibre
We found that @openmeteo/mapbox-layer demonstrated a healthy version release cadence and project activity because the last version was released less than a year ago. It has 3 open source maintainers collaborating on the project.
Did you know?

Socket for GitHub automatically highlights issues in each pull request and monitors the health of all your open source dependencies. Discover the contents of your packages and block harmful activity before you install or update your dependencies.
Product
Detect malware, unsafe data flows, and license issues in GitHub Actions with Socket’s new workflow scanning support.
Product
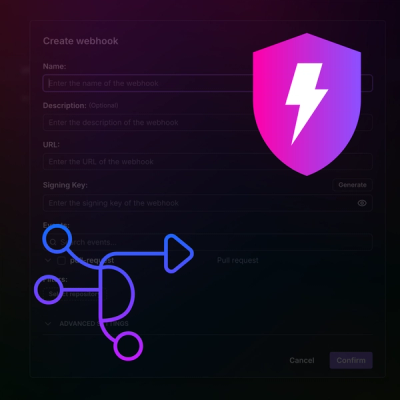
Add real-time Socket webhook events to your workflows to automatically receive pull request scan results and security alerts in real time.

Research
The Socket Threat Research Team uncovered malicious NuGet packages typosquatting the popular Nethereum project to steal wallet keys.