Product
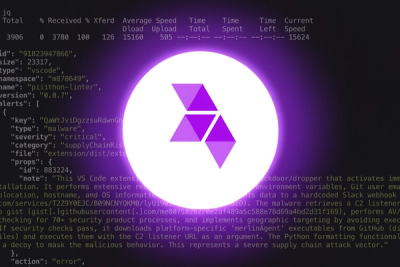
Introducing Socket Scanning for OpenVSX Extensions
Socket now scans OpenVSX extensions, giving teams early detection of risky behaviors, hidden capabilities, and supply chain threats in developer tools.
@opentelemetry/exporter-zipkin
Advanced tools
OpenTelemetry Zipkin Exporter allows the user to send collected traces to Zipkin.
OpenTelemetry Zipkin Trace Exporter allows the user to send collected traces to Zipkin.
Zipkin is a distributed tracing system. It helps gather timing data needed to troubleshoot latency problems in microservice architectures. It manages both the collection and lookup of this data.
npm install --save @opentelemetry/exporter-zipkin
Install the exporter on your application and pass the options. serviceName is an optional string. If omitted, the exporter will first try to get the service name from the Resource. If no service name can be detected on the Resource, a fallback name of "OpenTelemetry Service" will be used.
const { ZipkinExporter } = require('@opentelemetry/exporter-zipkin');

// Add your zipkin url (`http://localhost:9411/api/v2/spans` is used as
// default) and application name to the Zipkin options.
// You can also define your custom headers which will be added automatically.
const options = {
  headers: {
    'my-header': 'header-value',
  },
  url: 'your-zipkin-url',
  // optional interceptor
  getExportRequestHeaders: () => {
    return {
      'my-header': 'header-value',
    }
  }
}
const exporter = new ZipkinExporter(options);
Now, register the exporter and start tracing.
const tracerProvider = new NodeTracerProvider({
  spanProcessors: [new BatchSpanProcessor(exporter)]
})

const tracer = traceProvider.getTracer('my-tracer')
You can use built-in SimpleSpanProcessor or BatchSpanProcessor or write your own.
SpanProcessor that passes ended span directly to the configured SpanExporter.SpanProcessor that batches ended spans and pushes them to the configured SpanExporter. It is recommended to use this SpanProcessor for better performance and optimization.Please visit the Zipkin UI endpoint http://localhost:9411
Apache 2.0 - See LICENSE for more information.
Similar to the Zipkin exporter, the Jaeger exporter allows exporting traces to Jaeger, another open-source, end-to-end distributed tracing system. It provides functionality to send telemetry data to a Jaeger backend, facilitating the monitoring and troubleshooting of microservices-based distributed systems. The choice between Zipkin and Jaeger often depends on the specific needs of the project and the existing infrastructure.
While not directly similar in terms of exporting traces, the Prometheus exporter is another telemetry data exporter that focuses on metrics. It allows exporting metrics data to a Prometheus monitoring system. This package is useful for users who are looking to monitor their application's performance and health through metrics rather than tracing data. It complements the functionality provided by the Zipkin exporter by offering a different aspect of telemetry data monitoring.
FAQs
OpenTelemetry Zipkin Exporter allows the user to send collected traces to Zipkin.
The npm package @opentelemetry/exporter-zipkin receives a total of 4,431,617 weekly downloads. As such, @opentelemetry/exporter-zipkin popularity was classified as popular.
We found that @opentelemetry/exporter-zipkin demonstrated a healthy version release cadence and project activity because the last version was released less than a year ago. It has 2 open source maintainers collaborating on the project.
Did you know?

Socket for GitHub automatically highlights issues in each pull request and monitors the health of all your open source dependencies. Discover the contents of your packages and block harmful activity before you install or update your dependencies.

Product
Socket now scans OpenVSX extensions, giving teams early detection of risky behaviors, hidden capabilities, and supply chain threats in developer tools.

Product
Bringing supply chain security to the next generation of JavaScript package managers

Product
A safer, faster way to eliminate vulnerabilities without updating dependencies