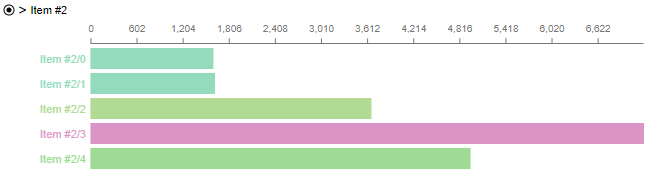
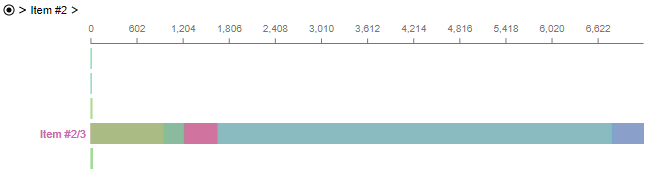
SegmentedBarChart

An animated horizontal multi level bar chart component. The user can click on bars and navigate within these levels. Changes will be displayed with smooth transitions.
The library has been developed with Angular 6. It should work with older versions of Angular too, but this isn't tested yet.
This repository is maintained by volunteers of OPITZ CONSULTING Deutschland GmbH.
There is a demo component SegmentedBarChartDemoComponent in this repository at https://github.com/opitzconsulting/ngx-d3.
npm install @opitzconsulting/segmented-bar-chart
In your application root module definition add SegmentedBarChartModule.
import { SegmentedBarChartModule } from '@opitzconsulting/segmented-bar-chart';
@NgModule({
bootstrap: [ ],
declarations: [ ],
imports: [
SegmentedBarChartModule
]
})
export class AppModule {}
In your components template add oc-segmented-bar-chart tag.
<oc-segmented-bar-chart [data]="data" width="500"></oc-segmented-bar-chart>
In your component class you can declare the data like following:
import { SegmentedBarChartData } from 'oc-segmented-bar-chart';
public data: SegmentedBarChartData[]: SegmentedBarChartData[] = [
{
caption: 'fruits', color: 'purple', segments: [
{ caption: 'apples', value: 10, color: 'green' },
{ caption: 'oranges', value: 20, color: 'orange' },
{ caption: 'bananas', value: 30, color: 'yellow' }
]
}
];
Please notice, tooltip values and x axis values are formated using Angulars DecimalPipe. Thousand and decimal separator could be changed by Angulars locale settings.
Properties:
data (SegmentedBarChartData[]) - Array of entries with caption and value. A fixed color can also be specified for each item optional. You can define further children by using segments property. For the last level you musst assign the value property.width (number) - The chart width in pixel (default 800).duration (number) - The duration of any animations in milliseconds (default 2500).
Events
chartClick: fires when click on a chart has occured, returns regarding chart entry.chartHover: fires when mouseover (hover) on a chart has occured, returns regarding chart entry.
License
This implementation is released unter the Apache License v2.
The library is based on D3.js, which has been published under an BSD 3-Clause "New" or "Revised" License.