Research
/Security News
Critical Vulnerability in NestJS Devtools: Localhost RCE via Sandbox Escape
A flawed sandbox in @nestjs/devtools-integration lets attackers run code on your machine via CSRF, leading to full Remote Code Execution (RCE).
@splunk/visualization-encoding-parsers
Advanced tools
Visualization encoding parsers transform data from datasources to props of react visualization components. A visualization encoding parser takes a datasources object and an optional encoding configuration, and returns props a react-visualization can under
Visualization encoding parsers transform data from datasources to props of react visualization components. A visualization encoding parser takes a datasources object and an optional encoding configuration, and returns props a react-visualization can understand to visualize data.
import { parse } from '@splunk/visualization-encoding-parsers/Base';
// data from datasources
const dataProps = parse(data, {
x: 'primary[0]',
y: 'primary[1]',
});
/*
parse returns dataProps as
{
x: [...], // data from the first column of the primary datasource
y: [...], // data from the second column of the primary datasource
_meta: {
fieldNames: {
x: 'xFieldName',
y: 'yFieldName'
},
},
}
*/
The base parser implements core functionality that all visualization specific parsers need, e.g. getting data based on data field references, or formatting data.
import { parse } from '@splunk/visualization-encoding-parsers/AreaParser';
import Area from '@splunk/react-visualizations/Area';

// data from datasources
const dataProps = parse(data);

<Area {...dataProps} />;
import { parse } from '@splunk/visualization-encoding-parsers/AreaParser';
import Area from '@splunk/react-visualizations/Area';

// data from datasources
const dataProps = parse(data, {
    x: 'primary._time',
    y: 'primary.count',
});

<Area {...dataProps} />;
The encoding config is an explicit way of mapping visualization dimensions (e.g. x, y, color, size) to data from a datasource. Each key represents a visual encoding in the visualization, each value represents a data field reference.
Explicit encoding with field name reference in datasource
{
    x: 'primary._time',
    y: 'primary.count'
}
// returns
{
    x: [...], // data from primary._time
    y: [...], // data from primary.count,
    _meta: {...} // meta data about the fields
}
A bit more loose encoding with field index reference in datasource. This is commonly used as fallback strategy when the field names are not (yet) known.
{
    x: 'primary[0]',
    y: 'primary[1]'
}
// returns
{
    x: [...], // data from first field index of primary
    y: [...], // data from second field index of primary
    _meta: {...} // meta data about the fields
}
Any visual encoding can also be powered by multiple fields from a datasource. The following is an example for multiple y series
{
    x: 'primary._time',
    y: ['primary.count1', 'primiary.count2']
}
// returns
{
    x: [...], // data for time
    y: [[...], [...]], // array of data arrays, first containing data for count1 field from primary datasource, second containing data for count2 field from primary datasource
    _meta: {...} // meta data about the fields
}
When it's not clear how many fields are available in a result set, or if the data fields change over time it's recommended to use index range field references with open boundaries. The following is an example for multiple y series, where the number of y series can be dynamic
{
    x: 'primary[0]',
    y: 'primary[1:]'
}
// returns
{
    x: [...], // first column of data
    y: [[...], [...], ...] // array of data arrays starting from column index 1 til end of datasource fields
    _meta: { ... } // meta data about fields
}
Two formatter configurations are supported at the moment:
Finds the range a numeric value fits in based on a range configuration and returns the specified value. The range is determined by matching from <= value < to. E.g with the following encoding example, the value 100 will be formatted to 'red' because 100 <= value. The value 66 will be formatted to 'green' because 50 <= 66 < 100
encoding: {
    color: {
        field: 'primary.count',
        format: {
            type: 'rangevalue',
            ranges: [
                {
                    from: 100,
                    value: 'red'
                },
                {
                    from: 50,
                    to: 100,
                    value: 'green'
                },
                {
                    to: 50,
                    value: 'red'
                }
            ]
        }
    }
}
{
    color: {
        field: 'primary.count',
        format: {
            ranges: [0, 10, 20, 50],
            values: ['#333', '#444', '#555', '#666']
        }
    }
}
{
    x: {
        field: 'primary.category',
        format: {
            categories: ['test', 'toast']
            values: [50, 100]
        }
    }
}
Note: If categories, ranges, and values are present in the formatter config, it will format the data based on the range value formatting and ignore the categories.
FAQs
Visualization encoding parsers transform data from datasources to props of react visualization components. A visualization encoding parser takes a datasources object and an optional encoding configuration, and returns props a react-visualization can under
The npm package @splunk/visualization-encoding-parsers receives a total of 72 weekly downloads. As such, @splunk/visualization-encoding-parsers popularity was classified as not popular.
We found that @splunk/visualization-encoding-parsers demonstrated a healthy version release cadence and project activity because the last version was released less than a year ago. It has 2 open source maintainers collaborating on the project.
Did you know?

Socket for GitHub automatically highlights issues in each pull request and monitors the health of all your open source dependencies. Discover the contents of your packages and block harmful activity before you install or update your dependencies.

Research
/Security News
A flawed sandbox in @nestjs/devtools-integration lets attackers run code on your machine via CSRF, leading to full Remote Code Execution (RCE).

Product
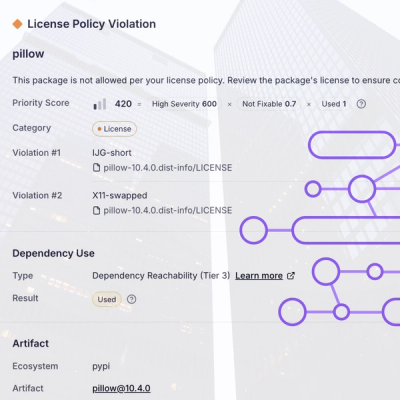
Customize license detection with Socket’s new license overlays: gain control, reduce noise, and handle edge cases with precision.

Product
Socket now supports Rust and Cargo, offering package search for all users and experimental SBOM generation for enterprise projects.