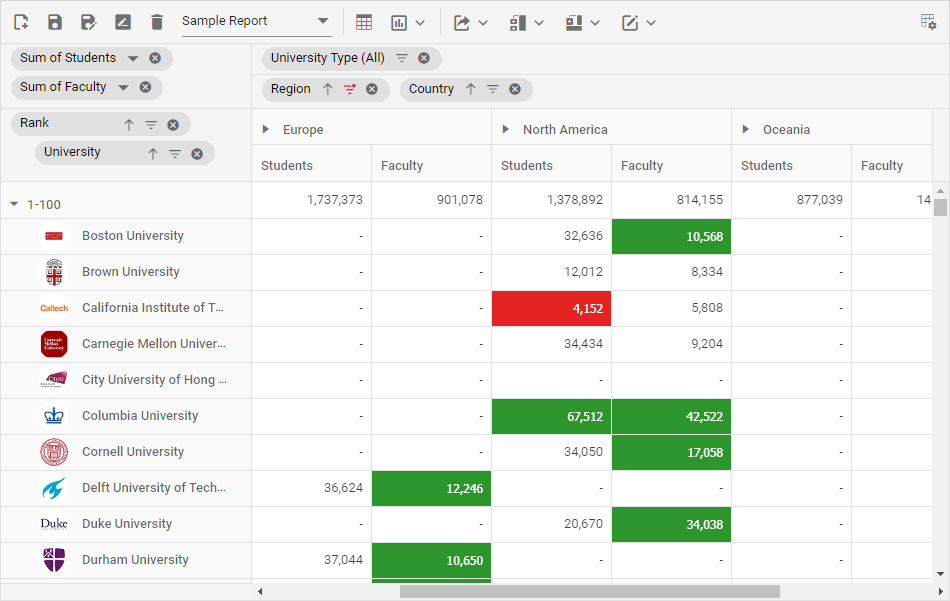
Angular Pivot Table Component
The Angular Pivot Table is a multi-dimensional data visualization component built on top of relational and OLAP data sources. The pivot report can be managed dynamically at runtime, along with other features such as graphical visualization (Pivot Chart), drill down/up, aggregation, filtering, sorting, grouping, conditional formatting, drill through, editing, hyperlink, and more. The large amounts of data are effectively handled by virtualization or paging support.
Getting started .
Online demos .
Learn more
Trusted by the world's leading companies

Setup
Create an Angular Application
You can use Angular CLI to setup your Angular applications. To install the Angular CLI, use the following command.
npm install -g @angular/cli
Create a new Angular application using the following Angular CLI command.
ng new my-app
cd my-app
Add Syncfusion® Pivot Table package
All Syncfusion® Angular packages are available in npmjs.com. To install the Angular Pivot Table package, use the following command.
ng add @syncfusion/ej2-angular-pivotview
The above command does the below configuration to your Angular app.
- Adds
@syncfusion/ej2-angular-pivotview package and its peer dependencies to your package.json file.
- Imports the
PivotViewModule in your application module app.module.ts.
- Registers the Syncfusion® UI default theme (material) in the
angular.json file.
This makes it easy to add the Syncfusion® Angular Pivot Table module to your project and start using it in your application.
Add Pivot Table component
In src/app/app.component.ts, use <ejs-pivotview> selector in the template attribute of the @Component directive to render the Syncfusion® Angular Pivot Table component.
import { Component, OnInit } from '@angular/core';
import { IDataOptions, IDataSet } from '@syncfusion/ej2-angular-pivotview';

@Component({
    selector: 'app-root',
    template: `<ejs-pivotview id='PivotView' height='350' [dataSourceSettings]=dataSourceSettings></ejs-pivotview>`
})
export class AppComponent implements OnInit {

    public pivotData: IDataSet[];
    public dataSourceSettings: IDataOptions;

    ngOnInit(): void {
        this.pivotData = [
            { 'Sold': 31, 'Amount': 52824, 'Country': 'France', 'Products': 'Mountain Bikes', 'Year': 'FY 2015', 'Quarter': 'Q1' },
            { 'Sold': 51, 'Amount': 86904, 'Country': 'France', 'Products': 'Mountain Bikes', 'Year': 'FY 2015', 'Quarter': 'Q2' },
            { 'Sold': 90, 'Amount': 153360, 'Country': 'France', 'Products': 'Mountain Bikes', 'Year': 'FY 2015', 'Quarter': 'Q3' },
            { 'Sold': 25, 'Amount': 42600, 'Country': 'France', 'Products': 'Mountain Bikes', 'Year': 'FY 2015', 'Quarter': 'Q4' },
            { 'Sold': 27, 'Amount': 46008, 'Country': 'France', 'Products': 'Mountain Bikes', 'Year': 'FY 2016', 'Quarter': 'Q1' }
        ];

        this.dataSourceSettings = {
            dataSource: this.pivotData,
            expandAll: false,
            columns: [{ name: 'Year', caption: 'Production Year' }, { name: 'Quarter' }],
            values: [{ name: 'Sold', caption: 'Units Sold' }, { name: 'Amount', caption: 'Sold Amount' }],
            rows: [{ name: 'Country' }, { name: 'Products' }]
        };
    }
}
Supported frameworks
Pivot Table component is also offered in the following list of frameworks.
Showcase samples
Key features
- Data sources: Binds the Pivot Table component with an array of JSON objects, CSV files, and web services. It also supports multi-dimensional data sources, such as OLAP.
- Pivot chart: Allows user to visualize the pivot data graphically with 20+ chart types.
- Drill down: Provides option to view the bound data in both detailed and abstract view.
- Filtering: Allows user to view only specific/desired records in the component.
- Sorting: Both member and value sorting are supported. It’s allows user to order fields and values (column) either in ascending or descending order respectively.
- Field list and grouping bar: Supports UI interaction at runtime to dynamically change the report along with sorting, filtering and remove options.
- Aggregation: Provides built-in aggregation types such as sum, count, product, average, min, max, and more.
- Calculated field: Users can add new value field(s) to the report dynamically using this option.
- Grouping: Allows you to automatically group date, time, number, and string data based on group interval.
- Virtual scrolling and paging: Provides the option to display large amounts of data page by page, using either virtual scrolling or pager UI.
- Drill through and editing: Provides the ability to perform CRUD operations such as creating, reading, updating, and deleting raw data at runtime via an interactive UI.
- Toolbar: Provides the option to access frequently used features like switching between pivot table and pivot chart, changing chart types, conditional formatting, exporting, and so on.
- Templates: Templates can be used to create custom user experiences in the pivot table.
- Export: Data can be exported to Excel, CSV, and PDF formats.
- Right-to-left (RTL): Aligns content in the Pivot Table component from right to left.
- Globalization: Personalize the Pivot Table component with different languages, as well as culture-specific date and number formatting.
Resources
Support
Product support is available through the following mediums.
Changelog
Check the changelog here. Get minor improvements and bug fixes every week to stay up to date with frequent updates.
License and copyright
This is a commercial product and requires a paid license for possession or use. Syncfusion® licensed software, including this component, is subject to the terms and conditions of Syncfusion® EULA. To acquire a license for 140+ Angular UI components, you can purchase or start a free 30-day trial.
A free community license is also available for companies and individuals whose organizations have less than $1 million USD in annual gross revenue and five or fewer developers.
See LICENSE FILE for more info.
© Copyright 2026 Syncfusion® Inc. All Rights Reserved. The Syncfusion® Essential Studio® license and copyright applies to this distribution.