Security News
Package Maintainers Call for Improvements to GitHub’s New npm Security Plan
Maintainers back GitHub’s npm security overhaul but raise concerns about CI/CD workflows, enterprise support, and token management.
activities-heatmap
Advanced tools
This library generates a heatmap based on activity data, highlighting routes and paths. The more frequently a path is used, the brighter it appears on the map. The library can be used to implement a tile layer server that renders heatmap tiles efficiently.
There are already tools and libraries to draw a heatmap of activities, for example strava-local-heatmap-tool. But the rendering is done on the client side, which can be inefficient for large dataset. As of November 2024, I have about 1800 activities representing 1.5 million vertices. Downloading and parsing the data on the client side would be prohibitive. That is why I developed that library for use on the server side with a Node.js application.
npm install activities-heatmap
The following code renders the heatmap for the tile x, y, z:
      import { HeatmapProducer } from 'activities-heatmap';

      const producer = new HeatmapProducer(datasource);
      const bitmap = await producer.BitmapForTile({x: x, y: y, z: z});
z is the zoom level, and x and y are tile coordinates, according to XYZ standard implemented in OpenLayers, Leaflet, Mapbox, etc.
The dataSource argument of HeatmapForTile represents an object that
provides access to activity data, and can retrieve paths within a given
bounding box. Two activities sources are provided:
StravaLocalZip: reads activities from a local zip bulk export from strava.PostgisDB: reads activities from a postgis database.You can implement your own data source by implementing the ActivitiesSource
interface.
data sources can optionally support filtering, to display the heatmap for a
subset of the activities only. By providing an activitiesFilter argument to
HeatmapForTile, it will pass than filter to the data source. Filter options
will be specific to each data source.
Both StravaLocalZip and PostgisDB support filtering by date, and by sport type.
If you implement your own datasource, you can decide which filters to
implement.
      const bitmap = await producer.BitmapForTile({
                                          x: x, y: y, z: z,
                                          activitiesFilter: {startDate: '2020-01-01', endDate: '2020-12-31'}
                                         });
You can customize the heatmap appeearance by passing a renderingOptions argument to HeatmapForTile.
The rendering options are:
valueForMaxColor: Specifies the threshold for the brightest color. If a path has been taken more than this number of times, it is rendered with the brightest color. (Default is 25).lineWidth: Defines the width of the lines in the heatmap. (Default is 2).gradientColors: An array of colors to use as linear gradients when picking a color for the path.
[ [0x4B, 0x00, 0x82, 130], [0xB2, 0x22, 0x22, 155], [0xFF, 0x00, 0x00, 180], [0xff, 0x45, 0x00, 205], [0xFF, 0x69, 0x00, 230], [0xFF, 0xFF, 0xE0, 255] ]. const bitmap = await producer.BitmapForTile({
x: x, y: y, z: z,
renderingOptions: {valueForMaxColor: 50, lineWidth: 3}
});
The heatmap is created by drawing activity paths on a bitmap. Each time a path goes trough a pixel, the count is incremented for that pixel. After all paths have been processed for, each pixel is colored according to the count.
I use anti-aliasing to avoid the heatmap paths from being blurry. It means that
I cannot use existing libraries like
node-canvas or
skia-canvas for line rendering,
and had to implement the line drawing algorithm inside the
activities-heatmap. With anti-aliasing and a configurable linewidth, it
requires to draw a polygon for each path. Fortunately, there are
good
resources
to implement that algorithm.
Indeed, each color channel contains only 256 values. So if I want to use 16 values for antialiasing, I would be able to draw only 16 (256/16) paths before reaching the maximum value. With the default value, the maximum color is applied for 25 paths. So in theory, I could have used 8 (256 / 32) levels of antialiasing. But I want to provide the ability to specify a value of more than 32.
Rendering paths is computationally intensive, and is done on the main thread. Unfortunately, moving the computation to a web worker would not improve the situation, since the serialization/deserialization of the paths would take longer than the computation itself.
The website at https://heatmap.renevier.net/ is a simple application that uses this library. It displays a heatmap of the author's list of Strava activities from 2018 to 2024. The code source is available at https://github.com/arenevier/heatmap-demo
strava blog about the implementation of the global heatmap: https://medium.com/strava-engineering/the-global-heatmap-now-6x-hotter-23fc01d301de
FAQs
A library to draw sport activities heatmap on a tile layer.
We found that activities-heatmap demonstrated a healthy version release cadence and project activity because the last version was released less than a year ago. It has 0 open source maintainers collaborating on the project.
Did you know?

Socket for GitHub automatically highlights issues in each pull request and monitors the health of all your open source dependencies. Discover the contents of your packages and block harmful activity before you install or update your dependencies.

Security News
Maintainers back GitHub’s npm security overhaul but raise concerns about CI/CD workflows, enterprise support, and token management.

Product
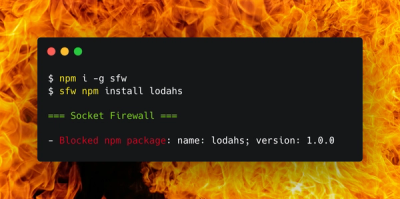
Socket Firewall is a free tool that blocks malicious packages at install time, giving developers proactive protection against rising supply chain attacks.

Research
Socket uncovers malicious Rust crates impersonating fast_log to steal Solana and Ethereum wallet keys from source code.