
Product
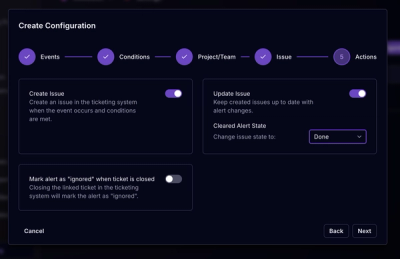
Socket for Jira Is Now Available
Socket for Jira lets teams turn alerts into Jira tickets with manual creation, automated ticketing rules, and two-way sync.
By Jeppe Hasseriis - Apr 20, 2026
ag-charts-vue
Advanced tools


| Module | Info |
|---|---|
| ag-charts-community |  |
| ag-charts-enterprise |  |
| ag-charts-vue |   |
AG Charts Vue
AG Charts is a fully-featured and highly customizable JavaScript charting library. The professional choice for developers building enterprise applications.
It delivers outstanding performance, has no third-party dependencies and integrates smoothly with all major JavaScript frameworks.

Here are some of the features that make AG Charts stand out:
| Supported Chart Types | Advanced Features | ||
|---|---|---|---|
|
Line, Bar & Area Scatter & Bubble Pie & Donut Histogram* Map* Candlestick & OHLC* Box Plot* |
Heatmap* Nightingale* Range Bar* & Range Area* Radar Area* & Radar Line* Radial Bar* & Radial Column* Sunburst* & Treemap* Bullet* |
Animation* Synchronized Charts* Context Menu* Crosshairs* Cross Lines Error Bars* |
Theming Zoom* |
* These are available in the Enterprise version only.
Check out the developer documentation for a complete list of features or visit our official docs for tutorials and feature demos.
Get started with Vue.
Installation for Vue.
If you have found a bug, please report it in this repository's issues section. If you're using the Enterprise version, please use the private ticketing system to do that.
Look for similar problems on StackOverflow using the ag-charts tag. If nothing seems related, post a new message there. Please do not use GitHub issues to ask questions. If you're using the Enterprise version, please use the private ticketing system to do that.
AG Charts is developed by a team of co-located developers in London. If you want to join the team send your application to info@ag-grid.com.
This project is licensed under the MIT license. See the LICENSE file for more info.
FAQs
AG Charts Vue Component
The npm package ag-charts-vue receives a total of 1,296 weekly downloads. As such, ag-charts-vue popularity was classified as popular.
We found that ag-charts-vue demonstrated a not healthy version release cadence and project activity because the last version was released a year ago. It has 1 open source maintainer collaborating on the project.
Did you know?

Socket for GitHub automatically highlights issues in each pull request and monitors the health of all your open source dependencies. Discover the contents of your packages and block harmful activity before you install or update your dependencies.
Product
Socket for Jira lets teams turn alerts into Jira tickets with manual creation, automated ticketing rules, and two-way sync.

Company News
Socket won two 2026 Reppy Awards from RepVue, ranking in the top 5% of all sales orgs. AE Alexandra Lister shares what it's like to grow a sales career here.

Security News
NIST will stop enriching most CVEs under a new risk-based model, narrowing the NVD's scope as vulnerability submissions continue to surge.