amcharts-nested-labels


Wrapper library to add nested labels to amcharts5 axes
NPM lib
Independent labels
 ref source code - codepen
Nested labels
 ref react source code - codesandbox
Prerequisites
- this library is meant to be used on data vizualization with axes created using amcharts5
Usage
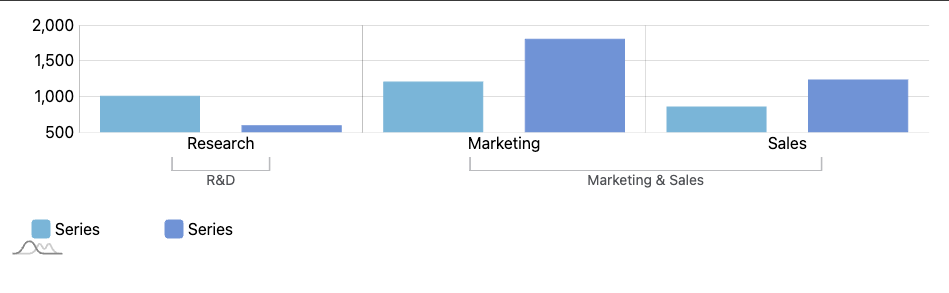
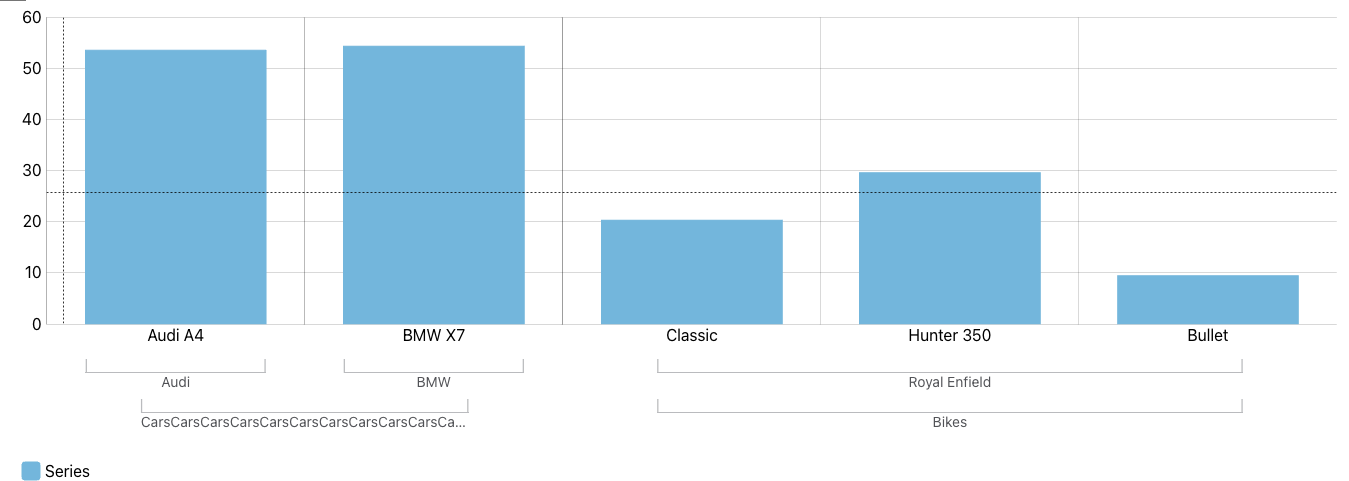
This library helps you to inject html in amcharts5 axes in a nested tree format as depicted in the sample image above
invoke createLabel with the required parameters to get nested axes labels
import { createLabel } from 'amcharts-nested-labels'
createLabel({
xAxisRef,
seriesRef,
startEndLabels: string[],
label: string,
dy?: (number) => number,
});
NOTE - labels passed in startEndLabels must be individual bars in the chart plot, else labels will not be placed correctly
Motivation
I faced a challenge to create a similar label vizualization.
Initially thought was to get x position of each bar and plot a label with html content(border)
Next challenge was calculating the html content width?
- should it stick to bar width?
- should it show the whole text content?
- what if the text overflows the bar and take too much space?
- finding x pos for each bar is expensive, can it be optimized?
Exploring solutions to the above, led me to axes range in a data viz libraries - amcharts axes
axes range - a range of values in the chart, can be a subset of the whole set of values
found a nifty answer to create nested labels using range and this library is product of the same!
Contributing
found the lib useful?
please create an issue to get the discussion started on any open bugs/feature requests


