angular-d3-charts


Integrate Angular 2+ app with interactive d3 charts e.g. Doughnut, Pie, Single Bar chart, Multiple bar chart and Stacked bar chart.
Beautiful charts for Angular2+ based on d3.js
Github
https://github.com/amanjain325/angular-d3-charts
Getting Started
npm install angular-d3-charts --save
Notice: The latest version on NPM may not reflect the branch master. Open an issue and tag me if you need it to be published.
Configuration
Add d3 script to your index.html
<script src="https://cdnjs.cloudflare.com/ajax/libs/d3/3.5.6/d3.min.js" charset="utf-8"></script>
Add these styles to your main stylesheet.
For Bar Charts Only
   .tick text {
        font-size: 12px;
    }

    .axis path,
    .axis line {
        fill: none;
        stroke: #4C5554;
        stroke-width: 1;
    }

    .x.axis .tick line {
        display: none
    }

    .domain {
        display: block !important;
        stroke: #4C5554 !important;
        stroke-width: 2 !important;
    }
    .legend {
        font-size: 12px;
        font-family: sans-serif;
        rect {
            stroke-width: 2;
        }
    }
Ensure you import the module:
import { DoughnutChartComponent, PieChartComponent, BarChartComponent } from 'angular-d3-charts';
@NgModule({
declarations: [
DoughnutChartComponent,
PieChartComponent,
BarChartComponent,
...OtherModules
]
})
export class AppModule {}
Usage
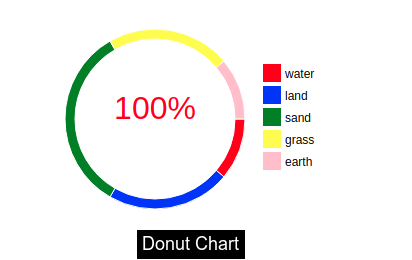
Doughnut Chart:
<angular-d3-donut [id]="donutChartId" [data]="donutChartData"></angular-d3-donut>
public donutChartData = [{
id: 0,
label: 'label name',
value: value,
color: 'color of slice',
iconImage: 'path of image'
},{
id: 1,
label: 'label name',
value: value,
color: 'color of slice',
iconImage: 'path of image'
}, ...
]
Example:
<angular-d3-donut [id]="donutChartId" [data]="donutChartData"></angular-d3-donut>
public donutChartData = [{
    id: 0,
    label: 'water',
    value: 20,
    color: 'red',
  }, {
    id: 1,
    label: 'land',
    value: 20,
    color: 'blue',
  }, {
    id: 2,
    label: 'sand',
    value: 30,
    color: 'green',
  }, {
    id: 3,
    label: 'grass',
    value: 20,
    color: 'yellow',
  }, {
    id: 4,
    label: 'earth',
    value: 10,
    color: 'pink',
  }];
Attributes
Attributes of angular-d3-donut are
It can contain the following properties.
Input
| id | donutChart | String | Unique Id of the donut chart. |
| width | 700 | Number | Width of the donut chart. |
| height | 400 | Number | Height of the donut chart. |
| outerRadius | 150 | Number | Outer radius of the donut chart. (Recommended to not to larger than 150) |
| innerRadius | 70 | Number | Inner radius of the donut chart. |
| data | Not set | Object | As above mentioned |
| centerImage | Not set | String | Path of center image in donut. |
| spreadSlice | False | Boolean | If you want to spread out the slide. |
| iconWidth | 40 | Number | Width of the icon images on slices. |
| iconHeight | 40 | Number | Height of the icon images on slices. |
| middleText | Not Set | String | Text in the middle of the inner circle |
| middleTextColor | Black | String | Color of the middle text |
| middleTextFontSize | 1em | String | Size of the middle text |
Output
| centerImageEvent | When center image is clicked, the centerImageEvent function triggers. |
<angular-d3-donut [spreadSlice]=true [centerImage]='centerImage' [data]="donutChartData" (centerImageEvent)="centerImageEvent()"></angular-d3-donut>
<angular-d3-donut [outerRadius]=100 [innerRadius]=80 [spreadSlice]=true [data]="piedata" (centerImageEvent)="centerImageEvent()"></angular-d3-donut>
<angular-d3-donut [width]=800 [outerRadius]=90 [middleText]="'test'" [middleTextFontSize]="'2em'" [middleTextColor]="'red'" [innerRadius]=80 [spreadSlice]=false [data]="piedata" [iconWidth]=20 [iconHeight]=20 (centerImageEvent)="centerImageEvent()"></angular-d3-donut>
For text in middle of Donut chart:
<angular-d3-donut [outerRadius]=100 [middleText]="'test'" [middleTextFontSize]="'2em'" [middleTextColor]="'red'" [innerRadius]=80 [spreadSlice]=false [data]="piedata" [iconWidth]=20 [iconHeight]=20 (centerImageEvent)="centerImageEvent()"></angular-d3-donut>
In your.component.ts file write
public centerImageEvent() {
}
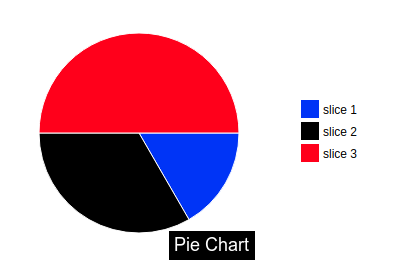
Pie Chart:
<angular-d3-pie [id]="pieChartId" [data]="pieChartData"></angular-d3-pie>
public pieChartData = [{
id: 0,
label: 'label name',
value: value,
color: 'color of slice',
},{
id: 1,
label: 'label name',
value: value,
color: 'color of slice',
}, ... ]
Example:
<angular-d3-pie [id]="pieChartId" [data]="pieChartData"></angular-d3-pie>
public pieChartData = [{
    id: 0,
    label: 'slice 1',
    value: 50,
    color: 'blue',
  }, {
    id: 1,
    label: 'slice 2',
    value: 20,
    color: 'black',
  }, {
    id: 2,
    label: 'slice 3',
    value: 30,
    color: 'red',
  }]
Attributes
Attributes of angular-d3-pie are
It can contain the following properties.
Input
| id | pieChart | String | Unique Id of the pie chart. |
| width | 700 | Number | Width of the pie chart. |
| height | 400 | Number | Height of the pie chart. |
| outerRadius | 150 | Number | Outer radius of the pie chart. (Recommended to not to larger than 150) |
| data | Not set | Object | As above mentioned |
| spreadSlice | False | Boolean | If you want to spread out the slide. |
<angular-d3-pie [spreadSlice]=true [data]="pieChartData" [outerRadius]=90></angular-d3-pie>
Bar Chart:
<angular-d3-bar [id]="barChartId" [data]="barChartData"></angular-d3-bar>
public barChartData = [{
id: 0,
label: 'label name',
value1: value,
value2: value,
value3: value,
... ,
valuen: value
},{
id: 1,
label: 'label name',
value1: value,
value2: value,
value3: value,
... ,
valuen: value
}, ... ]
Attributes
Attributes of angular-d3-bar are
It can contain the following properties.
Input
| id | barChart | String | Unique Id of the bar chart. |
| width | 700 | Number | Width of the bar chart. |
| height | 400 | Number | Height of the bar chart. |
| transitionDuration | 1000 | Number | The duration of the bar's transition (bar comes from x- axis). |
| transitionDelay | 100 | Number | The delay of the bar's transition. |
| barWidth | '11px' | String | Width of the bars. |
| yAxisd3Format | '.1S' | String | d3Format of Y axis, Refer to the d3 documentation. |
| data | Not set | Object | As above mentioned |
| colors | Not set | Array | Color of the bars. |
| dataGroup | 1 | Number | Number of data. (dataGroup > 1 for stacked bar chart.) |
| yAxisTicks | 10 | Number | Ticks on Y axis. |
| alphaDistance | 0.6 | Number | Distance between 2 bars, when chart is multi bar chart. |
| dataColumns | [1] | Array | Length of array = Number of columns ,Value on index = number of stacked bars on particular column. |
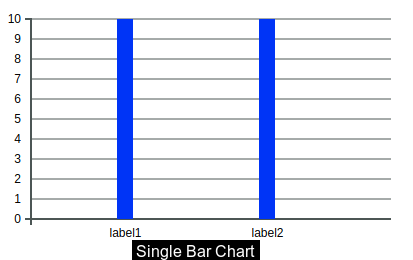
Single Bar Chart
dataColumns = [1];
<angular-d3-bar [id]="test2" [data]="barChartData" [dataColumns]="dataColumns" [colors]="colors" [yAxisTicks]=10 [width]=400 [height]=200 [transitionDuration]=1000 [transitionDelay]=30
[barWidth]="'16px'"></angular-d3-bar>
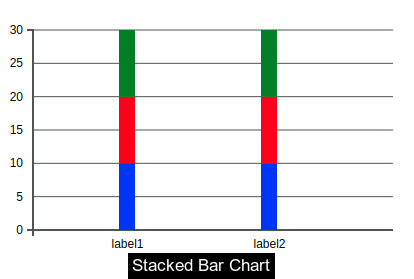
Stacked Bar Chart
dataColumns = [3];
<angular-d3-bar [id]="test1" [alphaDistance]="0.3" [data]="barChartData" [dataColumns]="dataColumns1" [colors]="colors" [yAxisTicks]=10 [width]=400 [height]=200 [transitionDuration]=1000 [transitionDelay]=30
[barWidth]="'16px'"></angular-d3-bar>
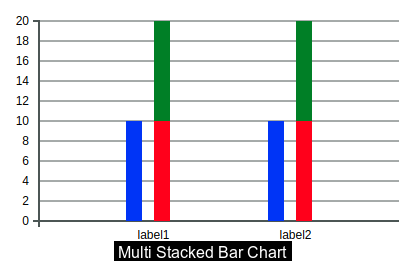
Multi Bar Chart
dataColumns = [3, 2];
<angular-d3-bar [id]="test1" [alphaDistance]="0.3" [data]="barChartData" [dataColumns]="dataColumns1" [colors]="colors" [yAxisTicks]=10 [width]=400 [height]=200 [transitionDuration]=1000 [transitionDelay]=30
[barWidth]="'16px'"></angular-d3-bar>
colors = ['red', 'blue', 'green']
Examples:
public colors = ['red', 'green', 'blue']
public dataColumns = [1];
public barChartData = [{
id: 0,
label: 'label1',
value1: 10,
value2: 10,
value3: 10,
},{
id: 1,
label: 'label2',
value1: 10,
value2: 10,
value3: 10,
}]
<angular-d3-bar [id]="test2" [data]="barChartData" [dataColumns]="dataColumns" [colors]="colors" [yAxisTicks]=10 [width]=400
[height]=200 [transitionDuration]=1000 [transitionDelay]=30 [barWidth]="'16px'"></angular-d3-bar>
Github
https://github.com/amanjain325/angular-d3-charts