Angular component for D3.js Calendar Heatmap
This d3.js heatmap representing time series data is used to visualize tracked time over the past year, showing details for each of the days on demand. Converted into an angular component for your convenience :)
Includes a global overview of multiple years and visualizations of year, month, week and day overview with zoom for details-on-demand.
Inspired by Github's contribution graph
Based on Calendar View by Mike Bostock
Aaand D3.js Calendar Heatmap by Darragh Kirwan
Demo
Click here for a live demo.
Global overview
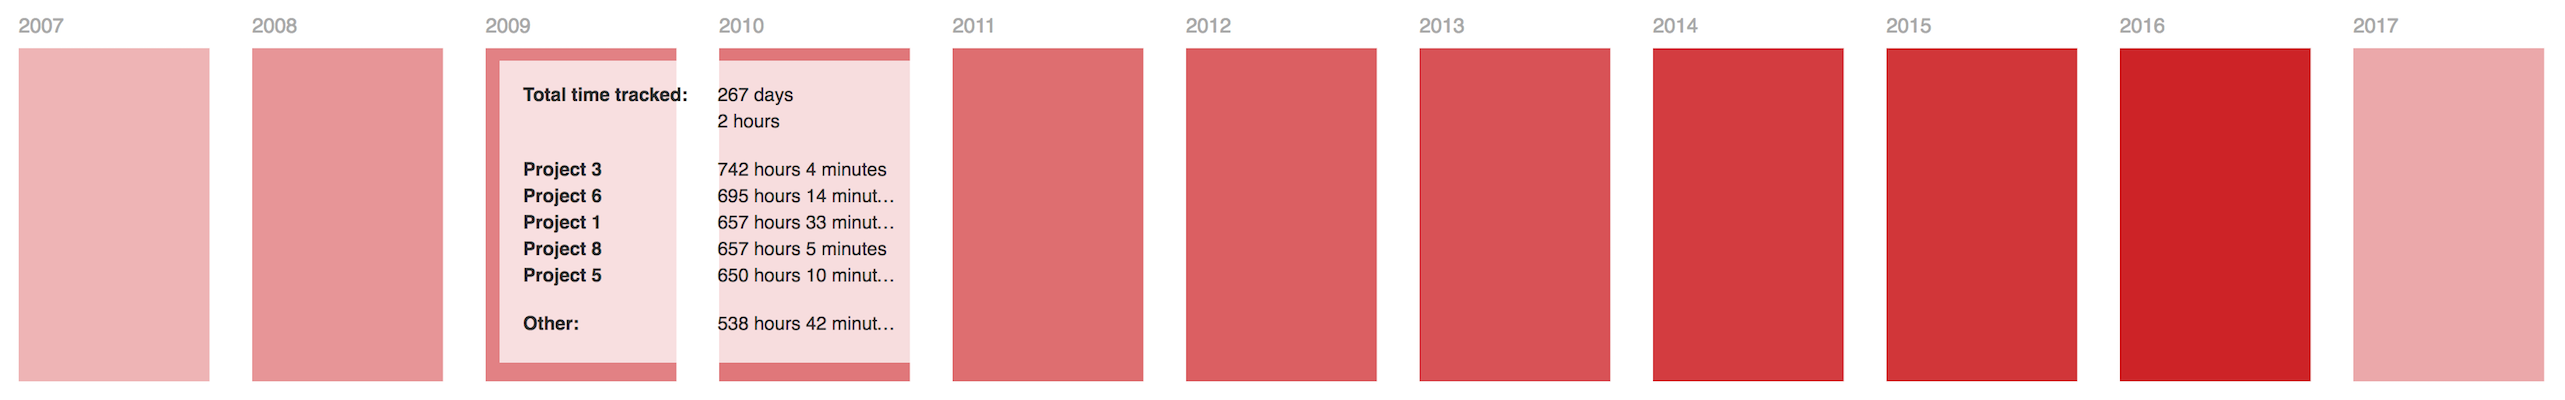
Year overview
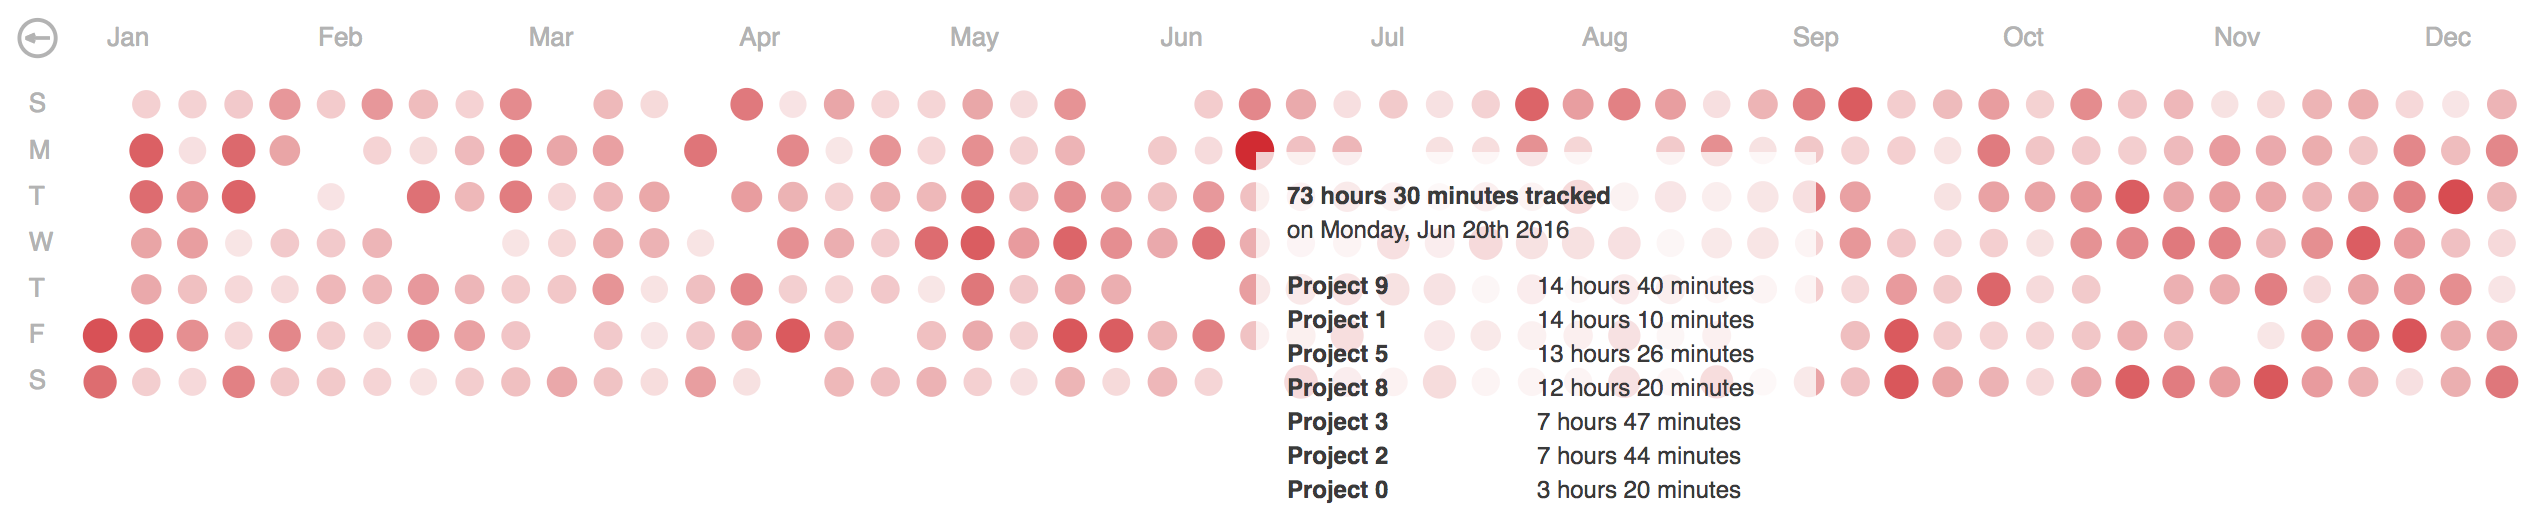
Month overview
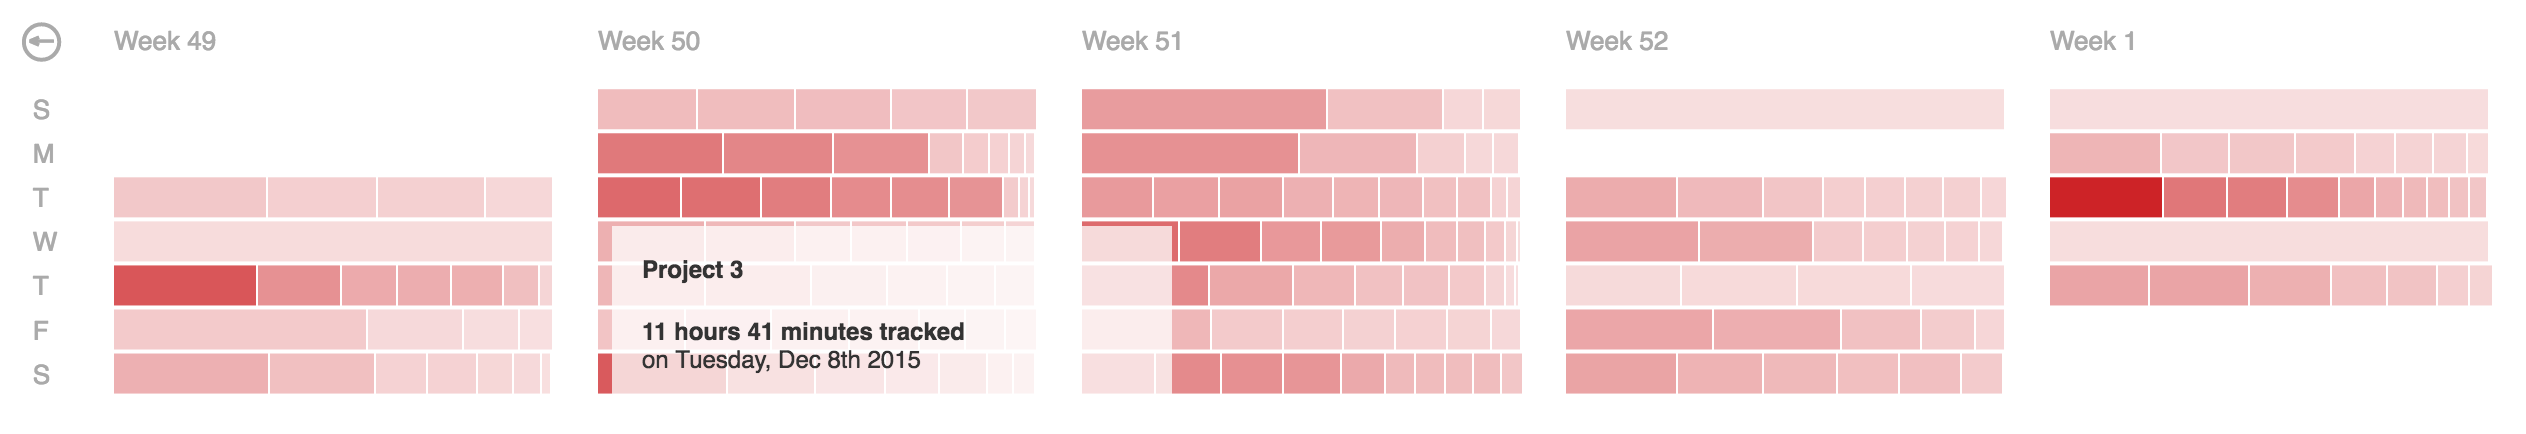
Week overview
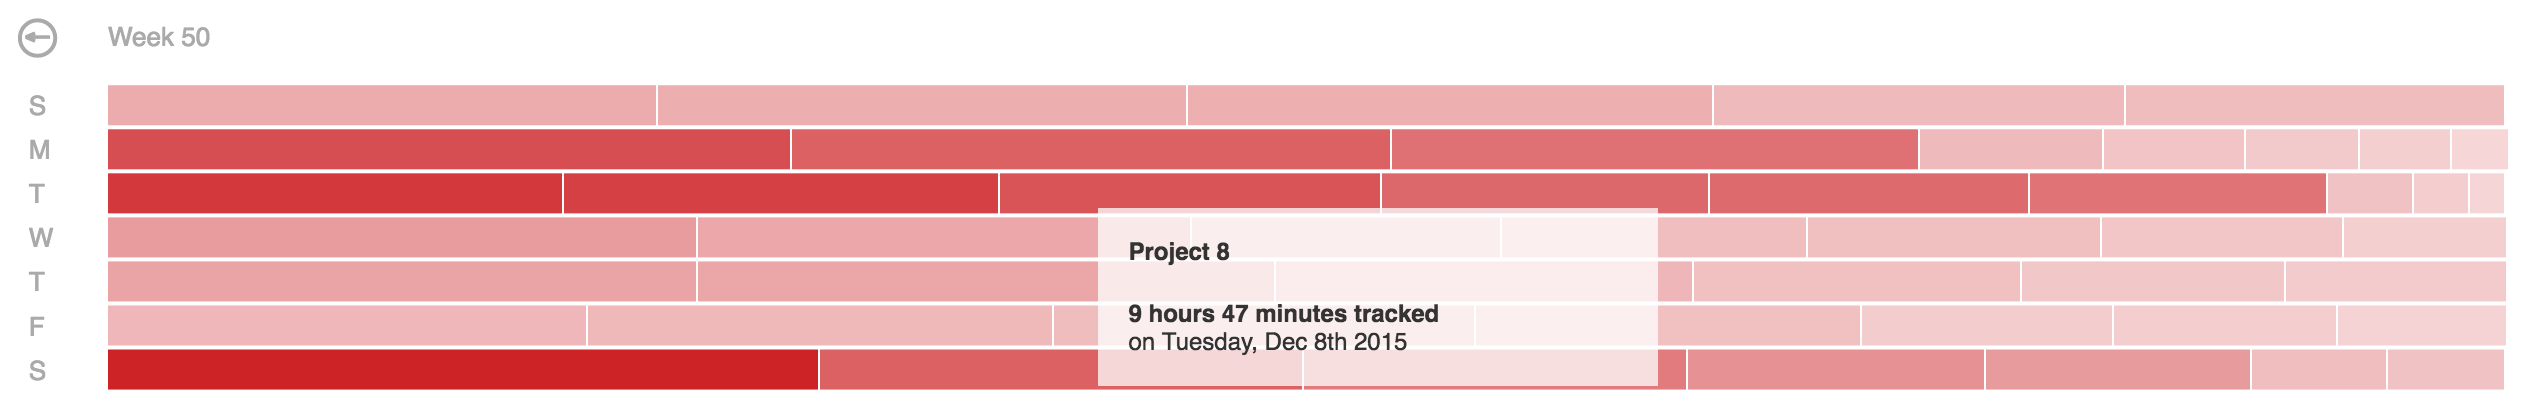
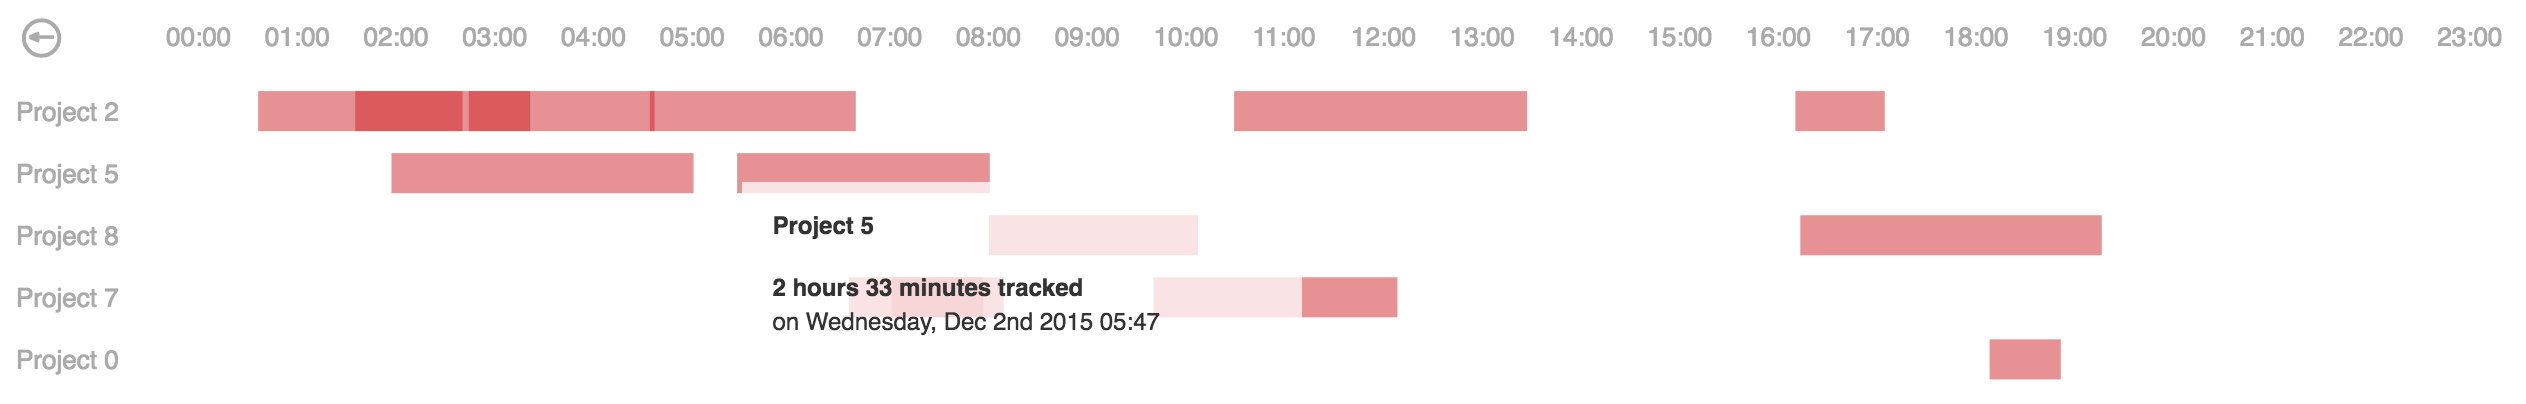
Day overview
Installation
- Install 'angular2-calendar-heatmap' with npm
npm install angular2-calendar-heatmap
- Import CalendarHeatmap component in your angular module
import { CalendarHeatmap } from 'angular2-calendar-heatmap';

declarations: [ ...... , CalendarHeatmap ],
- Use 'calendar-heatmap' component inside a template
<calendar-heatmap
  [data]="data"
  [color]="color"
  [overview]="overview"
  (handler)="print($event)">
</calendar-heatmap>
Attributes
| data | Time series data from max a year back | none | yes |
| color | Theme hex color | #45ff00 | no |
| overview | Initial overview type (choices are: year, month, day) | year | no |
| handler | Handler function is fired on click of a time entry in daily overview | none | no |
| onChange | Handler function is fired on change of the overview | none | no |
Example data
Time series data where each day has a total time tracked (in seconds).
Details, if provided, are shown in a tooltip on mouseover in different overviews.
var data = [{
  "date": "2016-01-01",
  "total": 17164,
  "details": [{
    "name": "Project 1",
    "date": "2016-01-01 12:30:45",
    "value": 9192
  }, {
    "name": "Project 2",
    "date": "2016-01-01 13:37:00",
    "value": 6753
  },
  .....
  {
    "name": "Project N",
    "date": "2016-01-01 17:52:41",
    "value": 1219
  }]
}]
Optimization
In some cases details array could be large and in order to fit the data into the tooltip a short summary is generated with distinct projects and their total tracked time for that date.
In terms of optimization, summary data can be computed server-side and passed in using the summary attribute.
And in addition to the data structure described above this would result in a summary dictionary with distinct project names and total values of tracked time in seconds, e.g.:
var data = [{
  "date": "2016-01-01",
  "total": 17164,
  "details": [.....],
  "summary": [{
    "name": "Project 1",
    "value": 9192
  }, {
    "name": "Project 2",
    "value": 6753
  },
  .....
  {
    "name": "Project N",
    "value": 1219
  }]
}]
See index.html for an example implementation with random data or click here for a live demo.
Angular directive
If you want to use this heatmap as an AngularJS directive (version 1.x), see angular-calendar-heatmap
React component
If you want to use this heatmap as a React component, see reactjs-calendar-heatmap
Non-Angular version
If you are looking for a plain vanilla javascript version of the heatmap, check out calendar-heatmap-graph
Dependencies


