Materials Cloud band structures widget
Library to plot band structures using chartjs library.
Installation
Include it in your code via the <script>tag:
<script src="dist/bandstructure.min.js"></script>
Configuration
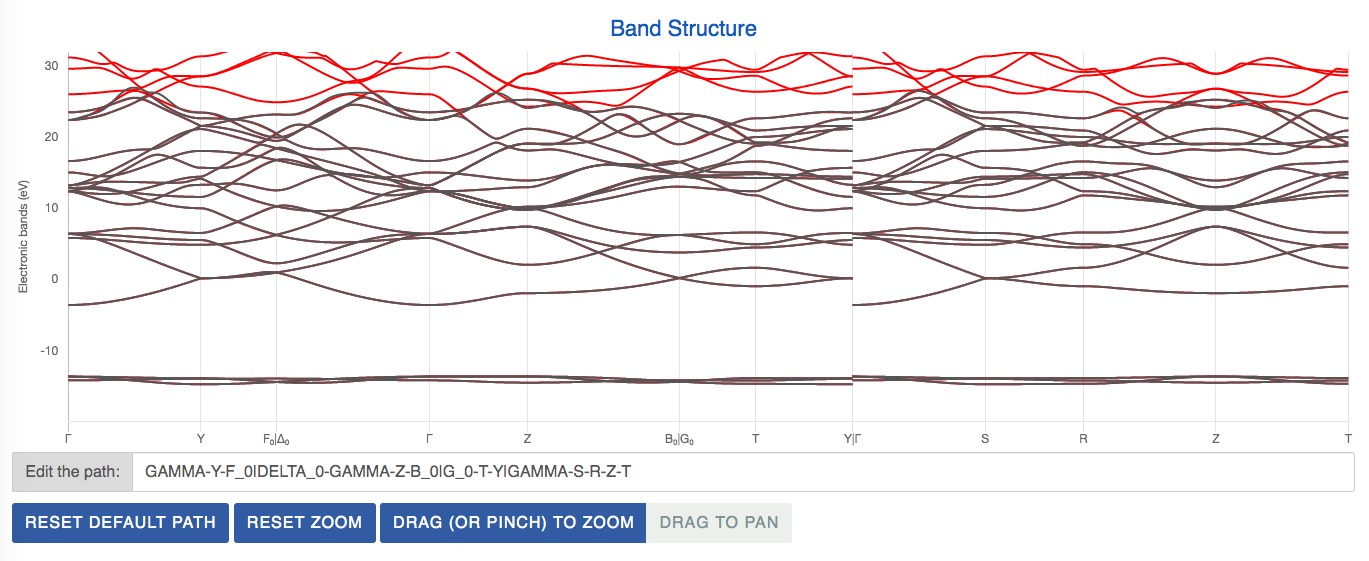
To plot the band structure below, create the files bands.html and bands.js as
shown below.
Output:
<!doctype html>
<html lang="en">
<head>
<meta charset="utf-8">
<title>Materials Cloud Bands Widget</title>
<meta name="description" content="">
<meta name="author" content="SitePoint">
<link rel="stylesheet" href="css/mcloud_theme.min.css">
<link rel="stylesheet" href="css/bands.css">
</head>
<body>
<div id="band-container" style="overflow-x: auto;">
<div id="band-metadata">
<div class="container-fluid">
<div class="row">
<div class="col-md-12">
<h3>Band Structure</h3>
<div>
<canvas id="band1" height="400px">
</canvas>
</div>
<p class="input-group input-group-div">
<span class="input-group-addon">Edit the path: </span>
<input id="bandPathTextBox1" class="input-group form-control input-path"
autocomplete="off" onkeyup="changeBandPath('bandPathTextBox1', 'band1')">
</p>
<button type="button" class="btn btn-primary btn-md reset-path-btn" title="Reset to default path"
onclick="resetDefaultBandPath('bandPathTextBox1', 'band1')">
Reset default path
</button>
<button type="button" class="btn btn-primary btn-md reset-path-btn" title="Reset zoom"
onclick="resetZoom('band1')">
Reset zoom
</button>
<div class="btn-group" role="group" aria-label="zoom-pan-mode">
<button type="button" class="btn btn-primary" id="band1Zoom" onclick="dragToZoom('band1', 'band1Zoom', 'band1Pan')">Drag (or pinch) to zoom</button>
<button type="button" class="btn btn-default" id="band1Pan" onclick="dragToPan('band1', 'band1Zoom', 'band1Pan')">Drag to pan</button>
</div>
</div>
</div>
</div>
</div>
</div>
</div>
<script src="js/jquery-3.5.1.min.js"></script>
<script src="js/jquery-ui.min.js"></script>
<script src="js/bootstrap.min.js"></script>
<script src="dist/bandstructure.min.js"></script>
<script src="js/bands.js"></script>
</body>
</html>
plots = {};
function changeBandPath (textBoxId, plotInfoId) {
var theTextBox = document.getElementById(textBoxId);
var string = theTextBox.value;
var finalPath = getPathArrayFromPathString(string);
plots[plotInfoId].plotObj.updateBandPlot(finalPath);
}
function resetDefaultBandPath (textBoxId, plotInfoId) {
var theTextBox = document.getElementById(textBoxId);
theTextBox.value = getPathStringFromPathArray(plots[plotInfoId].plotObj.getDefaultPath());
plots[plotInfoId].plotObj.updateBandPlot(plots[plotInfoId].plotObj.getDefaultPath(), true);
}
function resetZoom (plotInfoId) {
plots[plotInfoId].plotObj.resetZoom();
}
function dragToZoom (plotInfoId, zoomButtonId, panButtonId) {
$("#"+zoomButtonId).addClass('btn-primary');
$("#"+zoomButtonId).removeClass('btn-default');
$("#"+panButtonId).addClass('btn-default');
$("#"+panButtonId).removeClass('btn-primary');
plots[plotInfoId].plotObj.myChart.options.pan = {
enabled: false,
mode: "y"
};
plots[plotInfoId].plotObj.myChart.options.zoom = {
enabled: true,
mode: "y",
drag: true
};
plots[plotInfoId].plotObj.myChart.update();
}
function dragToPan (plotInfoId, zoomButtonId, panButtonId) {
$("#"+panButtonId).addClass('btn-primary');
$("#"+panButtonId).removeClass('btn-default');
$("#"+zoomButtonId).addClass('btn-default');
$("#"+zoomButtonId).removeClass('btn-primary');
plots[plotInfoId].plotObj.myChart.options.pan = {
enabled: true,
mode: "y"
};
plots[plotInfoId].plotObj.myChart.options.zoom = {
enabled: false,
mode: "y",
drag: true
};
plots[plotInfoId].plotObj.myChart.update();
}
function bandPlot(bandDivId, bandPathTextBoxId, dataFilePaths, colorInfo) {
plots[bandDivId] = {};
var theBandPlot = new BandPlot(bandDivId, 5.1, {"ymin": -20, "ymax": 32});
var colorDict;
dataFilePaths.forEach(function(dataFilePath, dataIdx) {
$.ajax({
url: dataFilePath,
async: false,
success: function (data) {
var colorDict;
if(colorInfo !== undefined) {
var newColor = tinycolor(colorInfo[dataIdx]);
colorDict = [newColor.toHexString(), newColor.darken(20).toHexString(), newColor.brighten(20).toHexString()];
}
theBandPlot.addBandStructure(data, colorDict);
}
});
});
theBandPlot.updateBandPlot();
var theTextBox = document.getElementById(bandPathTextBoxId);
theTextBox.value = getPathStringFromPathArray(theBandPlot.getDefaultPath());
var helperString = "Use - to define a segment<br>Use | to split the path.<br>Valid k-point names:<br>";
var validPoints = getValidPointNames(theBandPlot.allData);
helperString += validPoints.join(', ');
plots[bandDivId].plotObj = theBandPlot;
$(theTextBox).data('bs.tooltip', false).tooltip({title: helperString, html: true})
.tooltip('show');
}
$( document ).ready(function() {
bandPlot("band1", "bandPathTextBox1", ["data/b2y_entangled_SM_02.json", "data/b2y_dft.json"]);
});


