
Security News
Crates.io Users Targeted by Phishing Emails
The Rust Security Response WG is warning of phishing emails from rustfoundation.dev targeting crates.io users.
By Sarah Gooding - Sep 12, 2025
bull-dashboard-monitor
Advanced tools
A robust monitoring dashboard for BullMQ queues with automatic discovery, health checks, and metrics
A robust monitoring dashboard for BullMQ queues with automatic discovery, health checks, and metrics. This library provides a production-ready solution for monitoring distributed BullMQ queues across multiple applications.
npm install bull-dashboard-monitor
You'll need to install the peer dependencies:
npm install bullmq @bull-board/api @bull-board/express express ioredis
import BullMonitorFactory from 'bull-dashboard-monitor';
import express from 'express';

const app = express();

// Create a monitor instance
const monitor = BullMonitorFactory.create({
  redis: {
    host: 'localhost',
    port: 6379,
  },
  dashboard: {
    uiPath: '/admin/queues',
    refreshInterval: 30000,
  },
  registry: {
    heartbeatInterval: 30000,
    enableAutoCleanup: true,
  },
});

// Initialize the monitor
await monitor.initialize();

// Mount the dashboard
app.use('/admin', monitor.getRouter());

// Register a queue
await monitor.registerQueue('email-queue');

// Start the server
app.listen(3000, () => {
  console.log('Server running on http://localhost:3000');
  console.log('Queue dashboard available at http://localhost:3000/admin/queues');
});
import BullMonitorFactory from 'bull-dashboard-monitor';

// Create registry for registering queues
const registry = BullMonitorFactory.createRegistry({
  redis: { host: 'localhost', port: 6379 },
  registry: { heartbeatInterval: 30000 },
});

// Register queues
await registry.registerQueue('email-queue');
await registry.registerQueue('image-processing-queue');

// Queues will automatically send heartbeats
import BullMonitorFactory from 'bull-dashboard-monitor';
import express from 'express';

const app = express();

// Create dashboard for monitoring queues
const dashboard = BullMonitorFactory.createDashboard({
  redis: { host: 'localhost', port: 6379 },
  dashboard: {
    uiPath: '/queues',
    refreshInterval: 15000,
    enableHealthCheck: true,
  },
});

await dashboard.initialize();
app.use('/monitoring', dashboard.getRouter());

app.listen(3001, () => {
  console.log('Monitoring dashboard: http://localhost:3001/monitoring/queues');
});
const redisConfig = {
  // Connection options
  host: 'localhost',
  port: 6379,
  db: 0,

  // Or use connection string
  // url: 'redis://localhost:6379',

  // Connection settings
  retryDelayOnFailover: 100,
  maxRetriesPerRequest: 3,
  lazyConnect: true,
  enableOfflineQueue: false,
  keepAlive: 30000,
  connectTimeout: 10000,
  commandTimeout: 5000,
};
const dashboardConfig = {
  uiPath: '/queues',              // Dashboard UI path
  refreshInterval: 30000,         // Queue refresh interval (ms)
  maxStaleTime: 60000,           // Max time before queue is considered stale
  enableMetrics: true,           // Enable metrics endpoint
  enableHealthCheck: true,       // Enable health check endpoint
  healthCheckPath: '/health',    // Health check endpoint path
  maxRetries: 3,                // Max retry attempts for operations
  retryDelay: 1000,             // Delay between retries (ms)
};
const registryConfig = {
  heartbeatInterval: 30000,      // Heartbeat interval (ms)
  maxStaleTime: 60000,          // Max time before queue is considered stale
  enableAutoCleanup: true,      // Enable automatic cleanup of stale queues
  cleanupInterval: 60000,       // Cleanup interval (ms)
  maxRetries: 3,               // Max retry attempts
  retryDelay: 1000,            // Delay between retries (ms)
};
The main factory class for creating monitor instances.
create(config)Creates a complete monitor instance with both registry and dashboard.
const monitor = BullMonitorFactory.create({
  redis: { host: 'localhost', port: 6379 },
  dashboard: { uiPath: '/queues' },
  registry: { heartbeatInterval: 30000 },
});
createRegistry(config)Creates a registry-only instance for queue registration.
const registry = BullMonitorFactory.createRegistry({
  redis: { host: 'localhost', port: 6379 },
  registry: { heartbeatInterval: 30000 },
});
createDashboard(config)Creates a dashboard-only instance for monitoring.
const dashboard = BullMonitorFactory.createDashboard({
  redis: { host: 'localhost', port: 6379 },
  dashboard: { uiPath: '/queues' },
});
initialize()Initializes the monitor and starts the dashboard refresh cycle.
await monitor.initialize();
registerQueue(queueName, options)Registers a queue with optional configuration.
await monitor.registerQueue('email-queue', {
  enableHeartbeat: true,
  heartbeatInterval: 30000,
});
deregisterQueue(queueName)Deregisters a queue and stops its heartbeat.
await monitor.deregisterQueue('email-queue');
getRouter()Returns the Express router for the dashboard.
const router = monitor.getRouter();
app.use('/admin', router);
getHealth()Returns the health status of the monitor.
const health = await monitor.getHealth();
console.log(health);
destroy()Destroys the monitor and cleans up resources.
await monitor.destroy();
registerQueue(queueName, options)Registers a queue in the registry.
await registry.registerQueue('email-queue');
deregisterQueue(queueName)Deregisters a queue from the registry.
await registry.deregisterQueue('email-queue');
refreshHeartbeat(queueName)Manually refreshes the heartbeat for a queue.
await registry.refreshHeartbeat('email-queue');
getRegisteredQueues()Gets all registered queues.
const queues = await registry.getRegisteredQueues();
getActiveQueues()Gets all active queues (with recent heartbeats).
const activeQueues = await registry.getActiveQueues();
getStatistics()Gets registry statistics.
const stats = await registry.getStatistics();
initialize()Initializes the dashboard.
await dashboard.initialize();
getHealth()Gets dashboard health status.
const health = await dashboard.getHealth();
getMetrics()Gets dashboard and queue metrics.
const metrics = await dashboard.getMetrics();
The dashboard provides built-in health check endpoints:
GET /health
Returns:
{
  "status": "healthy",
  "timestamp": "2024-01-01T00:00:00.000Z",
  "redis": {
    "connected": true,
    "status": "ready"
  },
  "dashboard": {
    "initialized": true,
    "activeQueues": 3,
    "queueInstances": 3
  },
  "metrics": {
    "totalRefreshes": 100,
    "successfulRefreshes": 98,
    "failedRefreshes": 2,
    "lastRefreshTime": "2024-01-01T00:00:00.000Z"
  }
}
GET /metrics
Returns detailed metrics about the dashboard and queues.
BULL_MONITOR_LOG_LEVEL: Set log level (error, warn, info, debug)Always properly destroy instances when shutting down:
process.on('SIGTERM', async () => {
  await monitor.destroy();
  process.exit(0);
});
The library includes comprehensive error handling with retry mechanisms. Configure appropriate retry settings for your environment:
const monitor = BullMonitorFactory.create({
  redis: { host: 'localhost', port: 6379 },
  dashboard: {
    maxRetries: 5,
    retryDelay: 2000,
  },
  registry: {
    maxRetries: 3,
    retryDelay: 1000,
  },
});
Configure logging levels based on your environment:
# Development
BULL_MONITOR_LOG_LEVEL=debug

# Production
BULL_MONITOR_LOG_LEVEL=info
See the examples/ directory for complete usage examples:
basic-usage.js - Basic monitor setupregistry-only.js - Producer application exampledashboard-only.js - Monitoring application exampleadvanced-config.js - Advanced configuration examplegit checkout -b feature/amazing-feature)git commit -m 'Add amazing feature')git push origin feature/amazing-feature)MIT License - see the LICENSE file for details.
FAQs
A robust monitoring dashboard for BullMQ queues with automatic discovery, health checks, and metrics
We found that bull-dashboard-monitor demonstrated a healthy version release cadence and project activity because the last version was released less than a year ago. It has 1 open source maintainer collaborating on the project.
Did you know?

Socket for GitHub automatically highlights issues in each pull request and monitors the health of all your open source dependencies. Discover the contents of your packages and block harmful activity before you install or update your dependencies.
Security News
The Rust Security Response WG is warning of phishing emails from rustfoundation.dev targeting crates.io users.
Product
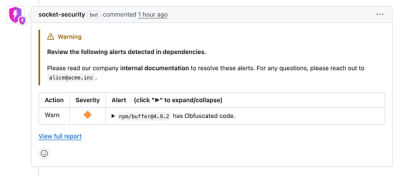
Socket now lets you customize pull request alert headers, helping security teams share clear guidance right in PRs to speed reviews and reduce back-and-forth.

Product
Socket's Rust support is moving to Beta: all users can scan Cargo projects and generate SBOMs, including Cargo.toml-only crates, with Rust-aware supply chain checks.