camera-canvas-svelte
Github
This is the package for creating simple p5 canvas in Svelte that has basic camera functionality build-in. With this you can draw different objects inside this environment with automatic screen coordinates to plane coordinates translation. This package also supports grid display as well as some mouse events capturing.
Basic usage:
<script lang="ts">
import Canvas from "camera-canvas-svelte";
const update = (cx) => {
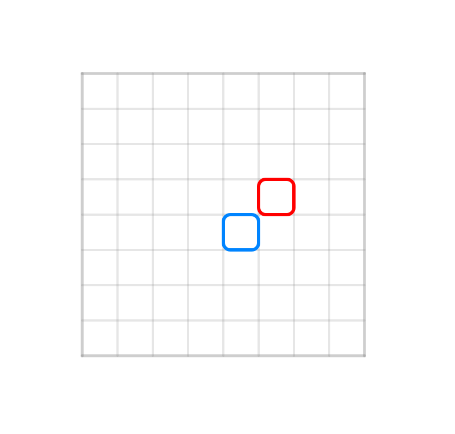
cx.strokeWeight(3);
cx.stroke(0, 132, 255);
cx.rect(0, 0, 1, 1, 0.2);
cx.stroke(255, 0, 0);
cx.rect(1, -1, 1, 1, 0.2);
}
</script>
<Canvas
width={400}
height={400}
minX={-4}
minY={-4}
maxX={4}
maxY={4}
{update}
/>
As result we get following canvas:
Camera can be setup with several parameters passed as props to Canvas component. Following properties are:
width : number
height : number
X : number = 0
Y : number = 0
minX : number = -1000
maxX : number = 1000
minY : number = -1000
maxY : number = 1000
hideBoundary : boolean = false
update : (cx)=>any
init : (cx)=>any
hideGrid : boolean = false
gridSize : number = 32
gridAutoResize : boolean = false
gridResizeFactor : number = 4
minGridSize : number = 8
scale : number = 1
minScale : number = 1 / 2 ** 4
maxScale : number = 2
backgroundColor : string | [number|number|number] = "#fff"
mouseClicked : (cx, PointerEvent) => any
mousePressed : (cx, PointerEvent) => any
mouseReleased : (cx, PointerEvent) => any
rightMousePressed : (cx, PointerEvent) => any
leftMousePressed : (cx, PointerEvent) => any
Draw functions
Under it's hood this library implements functions of p5.js, which are modified and put into cx object which is passed into events, update and init methods. All the basic drawing functions from p5.js which can be found in p5 documentation were recreated to work with this grid system. The list of supported functions and their references on p5:
2D Primitives:
Curves
Vertex
Colors
Noise
Translate
In order to preserve rest of the functionality other p5 methods can be accessed through variable: cx.p5.
Some new functions present, that can be used to switch between coordinates:
uvx(x: number): number
uvy(y: number): number
After passing coordinate from the plane it will return coordinate on the screen relative to canvas center. For example, to get coordinate on screen where (0, 0) is you may use: (cx.uvx(0), cx.uvy(0)).
Output of this function relies on the position of the coordinate center. In case you need to transform relative sizes, you may consider using function cx.uv(c : number) : number. For example, you need to set stroke of the line to be 0.1 in plane space. Then you may use function cx.strokeWeight(cx.uv(0.1)). Otherwise, in case you use just cx.strokeWeight(0.1), stroke size will be constant no matter how you zoom in or out.
Opposite transformation from the screen to coordinate space may be implemented with functions:
inx(x: number): number
iny(y: number): number
in(c: number): number
They will return coordinates transformed from coordinate on the screen to the coordinate on the plane.
Some constants from p5 were implemented:
POINTSPOINTSLINESTRIANGLESTRIANGLE_FANTRIANGLE_STRIPQUADSQUAD_STRIPCLOSEPITAUHPIDEGREESRADIANS
And some new constants were added:
cx.mx : number
cx.my : number
cx.mouseX : number
cx.mouseY : number
cx.mouseOutside : boolean
Other useful functions
Along side p5 functions this library implements new ones.
bound(x: number, min: number, max: number) : number
bounded(x: number, min: number, max: number) : boolean
region(
x: number,
y: number,
minX: number,
minY: number,
maxX: number,
maxY: number
): boolean
rectBounded(
x: number,
y: number,
x0: number,
y0: number,
w: number,
h: number
): boolean
boundedMouseX(min: number, max: number): boolean
boundedMouseY(min: number, max: number): boolean
regionMouse(
minX: number,
minY: number,
maxX: number,
maxY: number
): boolean
rectMouse(x: number, y: number, w: number, h: number): boolean
distance(x1: number, y1: number, x2: number, y2: number): number
distanceMouse(x: number, y: number): number
Examples
Click and translate
update=(cx) => {
  cx.strokeWeight(3);
  cx.setDash(5, 5);
  cx.stroke(128);
  cx.bezier(-1, -1.5, 0, -1.5, 0, 1.5, 1, 1.5);
  cx.stroke(0, 132, 255);
  cx.resetDash();
  cx.fill(0, 132, 255, 100);
  cx.setShadow(0, 0, 15, "#08f8");
  cx.rect(-2, -2, 0.9, 0.9, 0.2);
  cx.translate(3, 3);
  cx.rect(-2, -2, 0.9, 0.9, 0.2);
}
doubleClicked= (e, cx) => {
  if (cx.rectMouse(-2, -2, 1, 1)) {
    alert("Rectangle 1 double-clicked");
  }
  if (cx.rectMouse(1, 1, 1, 1)) {
    alert("Rectangle 2 double-clicked");
  }
}
Result:
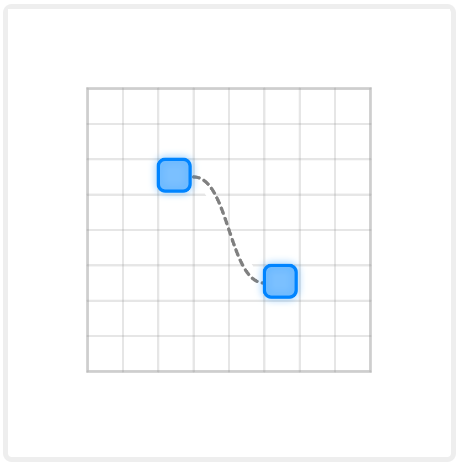
Here alert will be show if double click performed on one of the squares. cx.translate function shifts coordinates from (0, 0) to (3, 3), thus second rectangle is draw 3 grid units to left and 3 grid units to bottom relative to the first one.
Mouse coordinates
update=(cx) => {
  cx.strokeWeight(3);
  cx.stroke(128);
  cx.line(-0.5, 0.5, 2.5, 0.5);
  cx.line(-2.5, -1.5, -2.5, 2.5);
  cx.fill(200);
  cx.circle(-0.5, 0.5, 0.3);
  cx.circle(2.5, 0.5, 0.3);
  cx.circle(-2.5, -1.5, 0.3);
  cx.circle(-2.5, 2.5, 0.3);
  cx.stroke(0, 132, 255);
  cx.fill(0, 132, 255, 100);
  cx.setShadow(0, 0, 15, "#08f8");
  cx.rect(cx.bound(cx.mx - 0.5, -1, 2), 0, 1, 1, 0.2);
  cx.rect(-3, cx.bound(cx.my - 0.5, -2, 2), 1, 1, 0.2);
}
Result:
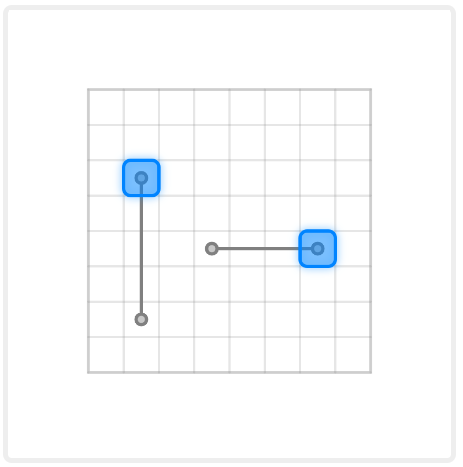
Two rectangles are being bounded to mouseX and mouseY so that they move with mouse. cx.bound constrains value of mouse coordinate between two positions so that squares don't go out of border.
Relative coordinates
update=(cx) => {
  cx.stroke(0, 132, 255);

  cx.strokeWeight(16);
  cx.point(-1, 0);
  cx.strokeWeight(4);
  cx.line(-2, -1, -2, 1);

  cx.strokeWeight(cx.uv(0.5));
  cx.point(1, 0);
  cx.strokeWeight(cx.uv(0.1));
  cx.line(2, -1, 2, 1);
}
Result:
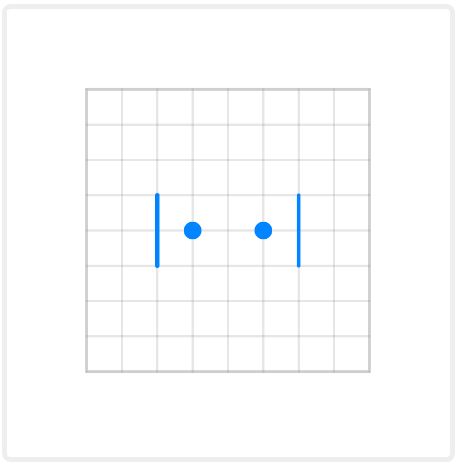
Here two coordinates systems are being used to set size for line and point stroke. Regular one sets size unrelated to screen. After applying cx.uv() to the stroke weight on the right side, point's and line's stroke remains relative to zoom, so it's changes when you zoom in or out.
Screen space draw
update=(cx) => {
  cx.stroke(0, 132, 255);
  cx.fill(0, 132, 255, 100);
  cx.setShadow(0, 0, 15, "#08f8");
  cx.rect(cx.inx(32), cx.iny(32), cx.in(64), cx.in(64), cx.in(8));
  cx.rect(-1, -1, 2, 2);
  cx.stroke(128);
  cx.setShadow(0, 0, 15, "#0002");
  cx.fill(128, 100);
  cx.p5.rect(-64, -64, 64, 64, 8);
}
Result:
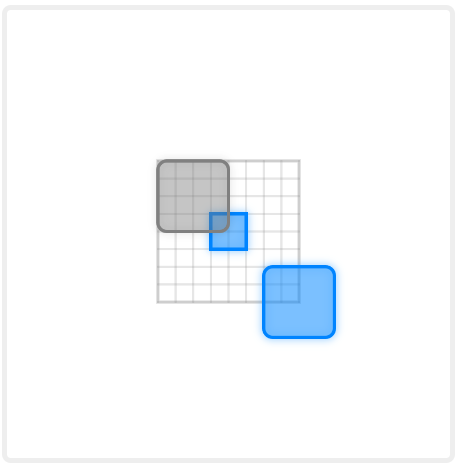 Here we draw three rectangles using screen space through
 cx.p5.rect drawing function or through cx.rect applying coordinates transform before passing coordinates. As result two rectangles are drawn on screen and do not move or zoom with the plane, while regular rectangle cx.rect(-1, -1, 2, 2) stays bound to plane.
Noise and shape
update=(cx) => {
  let t = cx.p5.frameCount / 60;
  cx.stroke(0, 132, 255);
  cx.fill(0, 132, 255, 100);
  cx.setShadow(0, 0, 15, "#08f8");
  cx.beginShape();
  cx.vertex(0, cx.noise(0, t) * 4);
  let n = Math.floor(cx.PI * 50);
  let d = 4;
  for (let i = 1; i < n - 3; i += 1) {
    let r = cx.noise((i / n) * d, t) * 4;
    let x = Math.sin((i / n) * cx.TAU) * r;
    let y = Math.cos((i / n) * cx.TAU) * r;
    cx.vertex(x, y);
  }
  cx.beginContour();
  cx.vertex(0, cx.noise(0, t) * 2);
  for (let i = 1; i < n - 3; i += 1) {
    let r = cx.noise((i / n) * d, t) * 2;
    let x = Math.sin(-(i / n) * cx.TAU) * r;
    let y = Math.cos(-(i / n) * cx.TAU) * r;
    cx.vertex(x, y);
  }
  cx.endContour();
  cx.endShape(cx.CLOSE);
}
Result:
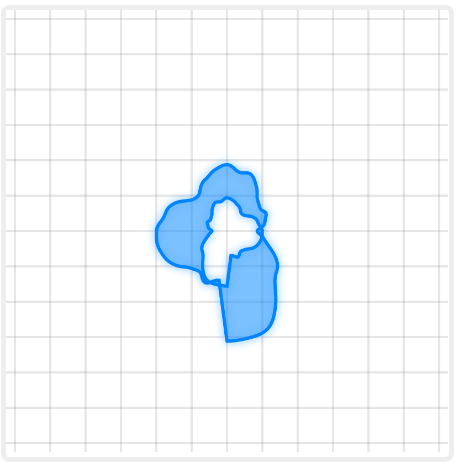
Here you can see figure that changes over time as frameCount increases each second by 60. We use cx.beginFigure() to start drawing figure and then in the loop we define it's vertices. Than in that figure we start contour cx.beginContour() to cut-out inside of that shape. then we close contour and figure via cx.endContour(); cx.endFigure(). As result we get random figure with random shaped hole in it.


