Introducing Socket Firewall: Free, Proactive Protection for Your Software Supply Chain.Learn More
Socket
Book a DemoInstallSign in
Socket

canvas-chart

Package Overview
Dependencies
Maintainers
1
Versions
5
Alerts
File Explorer

Advanced tools

Socket logo

Install Socket

Detect and block malicious and high-risk dependencies

Install

canvas-chart

Takes an array of data points, makes a canvas of them and saves it as a .png image

latest
Source
npmnpm
Version
1.3.0
Version published
Maintainers
1
Created
Source

Canvas chart

Takes an array of data points, makes a canvas of it and save as a PNG

Installation

npm install canvas-chart --save-dev

Graph types

The implemented graph types

  • Line

Standard settings

{
    filename: 'public/out',
    grid: true,
    height: 450,
    lineWidth: 3,
    points: true,
    pointFill: '#fff',
    pointStroke: '#000',
    stroke: true,
    strokeColor: '#000',
    type: 'line',
    width: 800
}

Use

  var chart = require('canvas-chart');
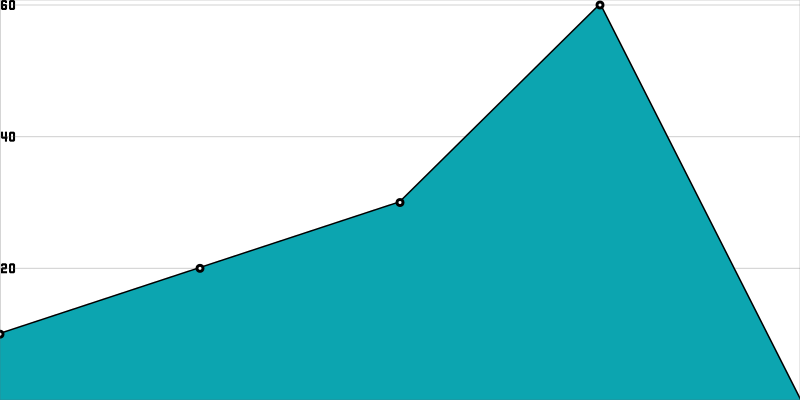
  var data = [10, 20, 30, 60];

  chart.graph(data, {
    filename: 'movies',
    fillColor: 'rgba(12, 165, 176, 1)'
  });
  

This writes a .png at public/movies.png that looks like this:

Movies

Keywords

canvas

FAQs

Package last updated on 02 Nov 2014

Did you know?

Socket

Socket for GitHub automatically highlights issues in each pull request and monitors the health of all your open source dependencies. Discover the contents of your packages and block harmful activity before you install or update your dependencies.

Install

Related posts