Chart.js Geo


Chart.js module for charting maps with legends. Adding new chart types: choropleth and bubbleMap.

works great with https://github.com/chartjs/chartjs-plugin-datalabels
Related Plugins
Check out also my other chart.js plugins:
Install
npm install --save chart.js chartjs-chart-geo
Usage
see https://www.sgratzl.com/chartjs-chart-geo/ website
CodePens
Options
The option can be set globally or per dataset
see https://github.com/sgratzl/chartjs-chart-geo/blob/main/src/controllers/GeoController.ts#L221
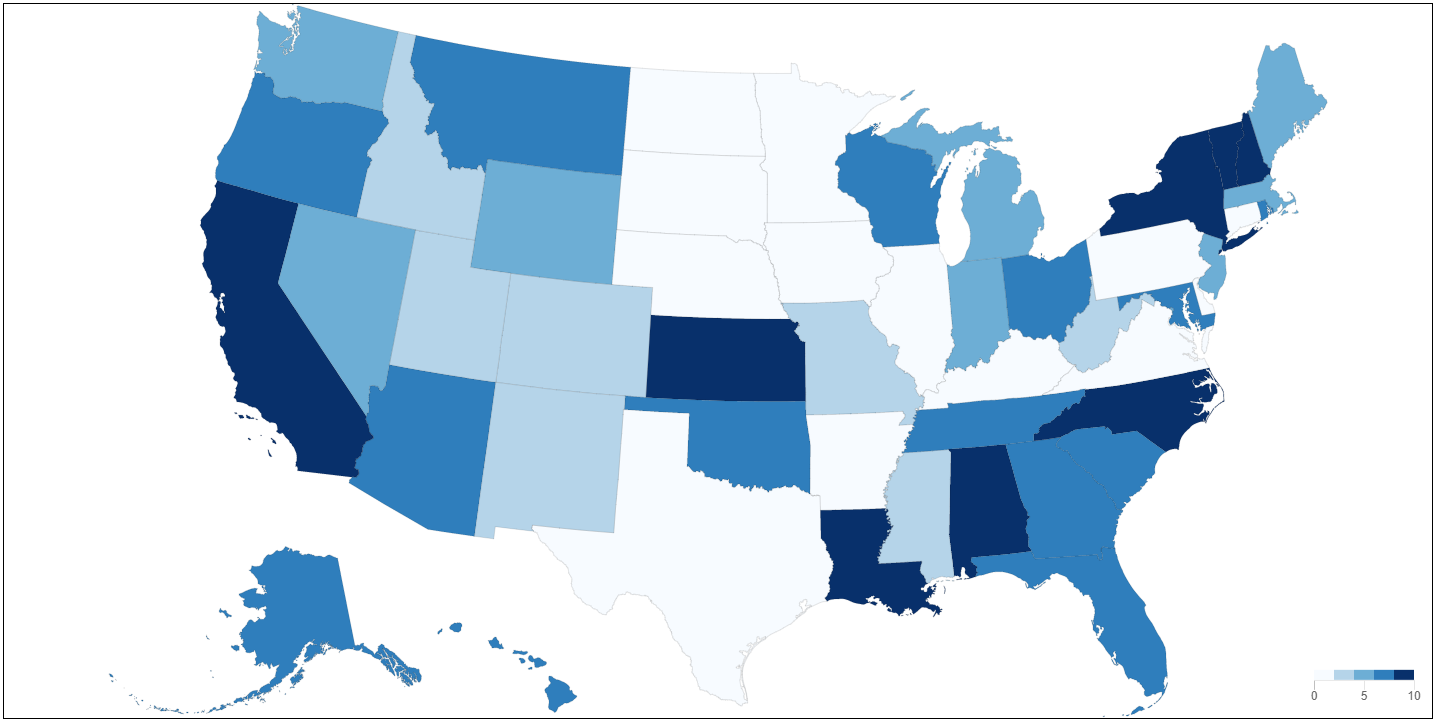
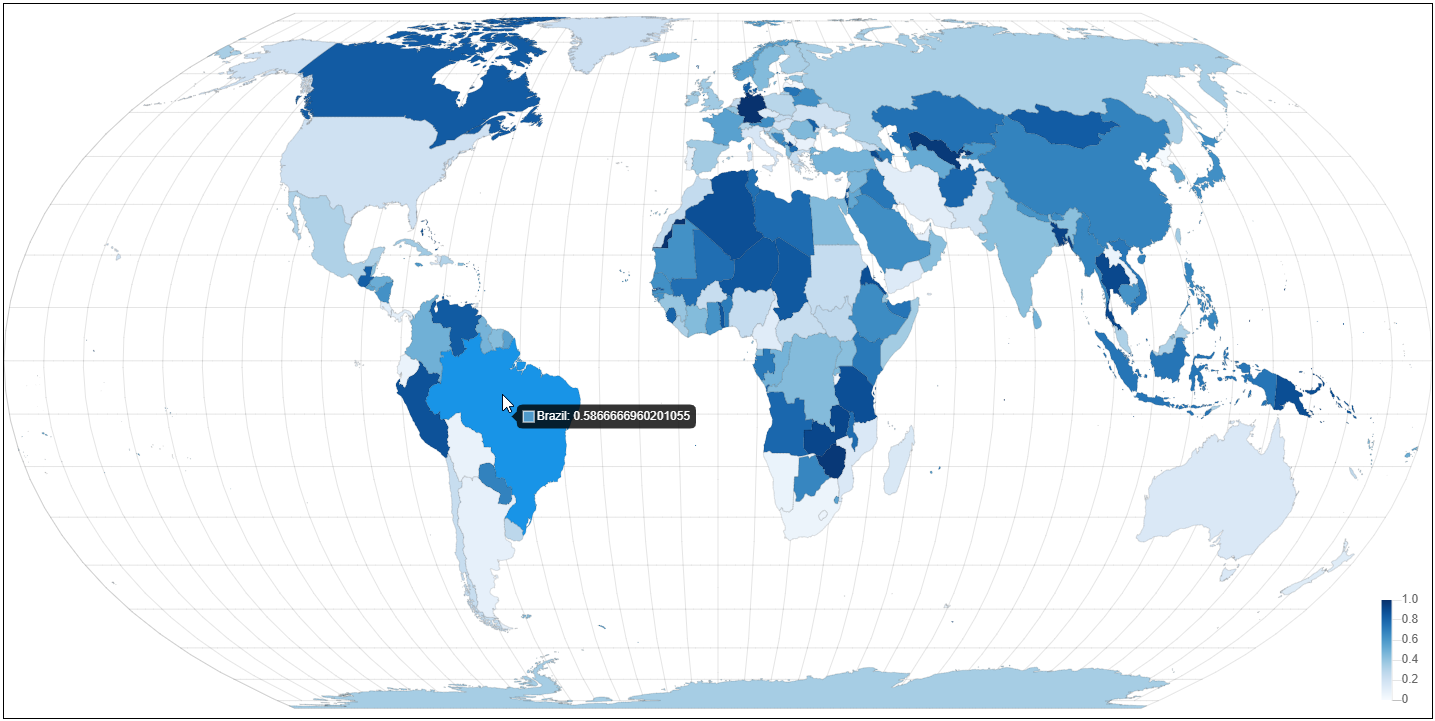
Choropleth
A Choropleth (chart type: choropleth) is used to render maps with the area filled according to some numerical value.
Data Structure
A data point has to have a .feature property containing the feature to render and a .value property containing the value for the coloring.
TopoJson is packaged with this plugin to convert data, it is exposed as ChartGeo.topojson in the global context. However, this plugin doesn't include any topojson files itself. Some useful resources I found so far:
const us = await fetch('https://cdn.jsdelivr.net/npm/us-atlas/states-10m.json').then((r) => r.json());
const nation = ChartGeo.topojson.feature(us, us.objects.nation).features[0];
const states = ChartGeo.topojson.feature(us, us.objects.states).features;
const alaska = states.find((d) => d.properties.name === 'Alaska');
const california = states.find((d) => d.properties.name === 'California');
...
const config = {
data: {
labels: ['Alaska', 'California'],
datasets: [{
label: 'States',
outline: nation,
showOutline: true,
data: [
{
value: 0.4,
feature: alaska
},
{
value: 0.3,
feature: california
}
]
}]
},
options: {
scales: {
projection: {
projection: 'albersUsa'
}
}
}
};
Styling
The styling of the new element GeoFeature is based on Bar Element with some additional options for the outline and graticule.
see https://github.com/sgratzl/chartjs-chart-geo/blob/main/src/elements/GeoFeature.ts#L41
Legend and Color Scale
The coloring of the nodes will be done with a special color scale. The scale itself is based on a linear scale.
see
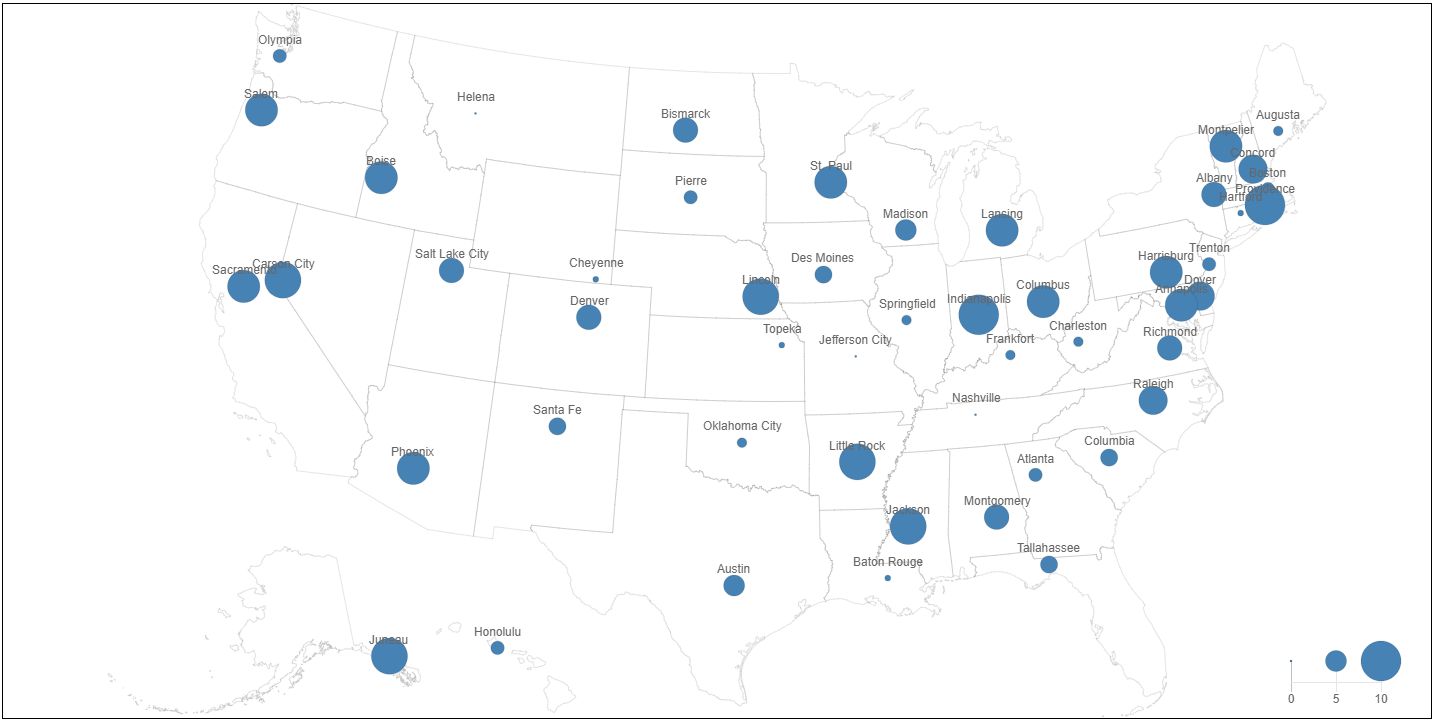
Bubble Map
A Bubble Map (chart type: bubbleMap) aka Proportional Symbol is used to render maps with dots that are scaled according to some numerical value. It is based on a regular bubble chart where the positioning is done using latitude and longitude with an additional sizeScale to create a legend for the different radi.
Data Structure
see Bubble Chart. Alternatively to x and y, the following structure can be used:
interface IBubbleMapPoint {
  longitude: number;
  latitude: number;
  value: number;
}
Note: instead of using the r attribute as in a regular bubble chart, the value attribute is used, which is picked up by the sizeScale to convert it to an actual pixel radius value.
Styling
A regular point is used and thus supports the Point Element styling options. In addition, the outline* and graticule* are supported.
Legend
Similar to the choropleth chart a new sizeScale is used to map the values to symbol radius size. The scale itself is based on a linear scale.
see
Scales
A new scale projection is registered and used by default by Choropleth and BubbleMap. The available methods are the one from https://github.com/d3/d3-geo#projections. Just remove the geo prefix. Alternatively, the projection method instance can be directly given.
see https://github.com/sgratzl/chartjs-chart-geo/blob/main/src/scales/ProjectionScale.ts#L76
ESM and Tree Shaking
The ESM build of the library supports tree shaking thus having no side effects. As a consequence the chart.js library won't be automatically manipulated nor new controllers automatically registered. One has to manually import and register them.
Variant A:
import { Chart } from 'chart.js';
import { ChoroplethController, GeoFeature, ColorScale, ProjectionScale } from 'chartjs-chart-geo';
Chart.register(ChoroplethController, GeoFeature, ColorScale, ProjectionScale);
const chart = new Chart(document.getElementById('canvas').getContext('2d'), {
type: 'choropleth',
data: {
},
});
Variant B:
import { ChoroplethChart } from 'chartjs-chart-geo';
const chart = new ChoroplethChart(document.getElementById('canvas').getContext('2d'), {
data: {
},
});
Development Environment
npm i -g yarn
yarn install
yarn sdks vscode
Common commands
yarn compile
yarn test
yarn lint
yarn fix
yarn build
yarn docs