Security News
Crates.io Users Targeted by Phishing Emails
The Rust Security Response WG is warning of phishing emails from rustfoundation.dev targeting crates.io users.
By Sarah Gooding - Sep 12, 2025
chartjs-chart-graph-dagre
Advanced tools
![]()
![]()
Adds another graph controller dagre to chart.js based on chartjs-chart-graph which uses the Dagre library for performing the graph layout.
Check out also my other chart.js plugins:
npm install --save chart.js chartjs-chart-graph chartjs-chart-graph-dagre
see Samples on Github
The options are wrapper for specifying dagre graph, node, and edge options. see https://github.com/dagrejs/dagre/wiki#configuring-the-layout.
interface IDagreOptions {
  dagre: {
    /**
     * dagre graph options
     */
    graph: {};
    /**
     * dagre node options or a function generating the option per node
     */
    node: ((i: number) => {}) | {};
    /**
     * dagre edge options or a function generating the option per edge
     */
    edge: ((source: number, target: number) => {}) | {};
  };
}
The ESM build of the library supports tree shaking thus having no side effects. As a consequence the chart.js library won't be automatically manipulated nor new controllers automatically registered. One has to manually import and register them.
Variant A:
import Chart from 'chart.js';
import { EdgeLine } from 'chartjs-chart-graph';
import { DagreGraphController } from 'chartjs-chart-graph-dagre';

// register controller in chart.js and ensure the defaults are set
Chart.register(DagreGraphController, EdgeLine);
...

new Chart(ctx, {
  type: DagreGraphController.id,
  data: [...],
});
Variant B:
import { DagreGraphChart } from 'chartjs-chart-graph-dagre';

new DagreGraphChart(ctx, {
  data: [...],
});
npm i -g yarn
yarn set version 2
yarn install
yarn pnpify --sdk vscode
yarn install
yarn build
FAQs
Chart.js graph chart extension using the dagre layout
We found that chartjs-chart-graph-dagre demonstrated a not healthy version release cadence and project activity because the last version was released a year ago. It has 1 open source maintainer collaborating on the project.
Did you know?

Socket for GitHub automatically highlights issues in each pull request and monitors the health of all your open source dependencies. Discover the contents of your packages and block harmful activity before you install or update your dependencies.
Security News
The Rust Security Response WG is warning of phishing emails from rustfoundation.dev targeting crates.io users.
Product
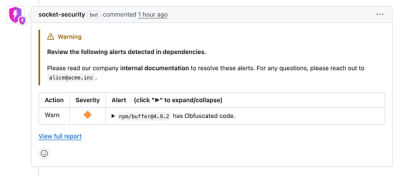
Socket now lets you customize pull request alert headers, helping security teams share clear guidance right in PRs to speed reviews and reduce back-and-forth.

Product
Socket's Rust support is moving to Beta: all users can scan Cargo projects and generate SBOMs, including Cargo.toml-only crates, with Rust-aware supply chain checks.