Product
Socket for Jira Is Now Available
Socket for Jira lets teams turn alerts into Jira tickets with manual creation, automated ticketing rules, and two-way sync.
By Jeppe Hasseriis - Apr 20, 2026
chartjs-chart-venn
Advanced tools
![]()
![]()
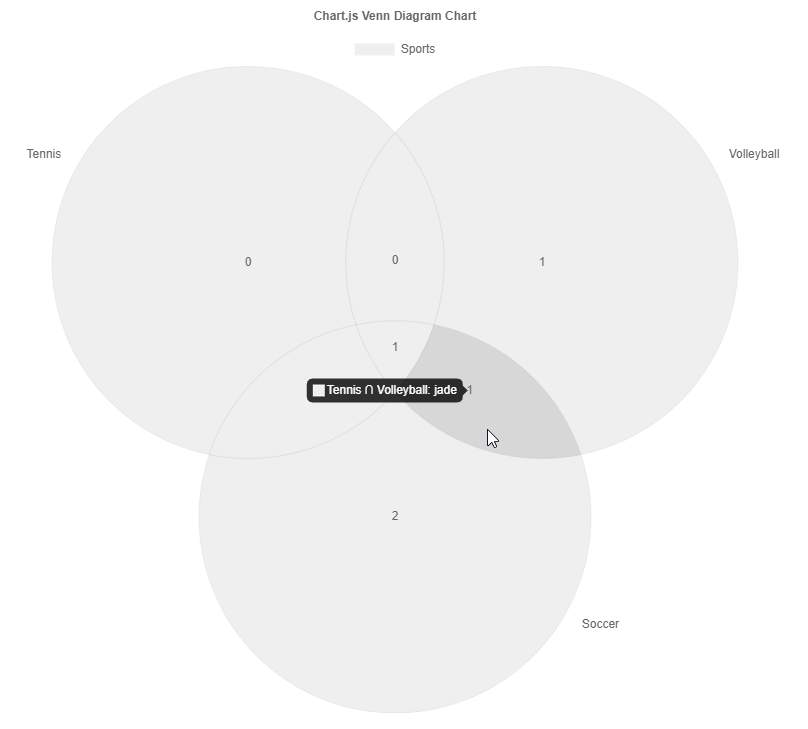
Chart.js module for charting venn diagrams with up to five sets. Adding new chart type: venn and euler.
Check out also my other chart.js plugins:
npm install --save chart.js chartjs-chart-venn
see Examples
or at this
const config = {
  type: 'venn',
  data: ChartVenn.extractSets(
    [
      { label: 'Soccer', values: ['alex', 'casey', 'drew', 'hunter'] },
      { label: 'Tennis', values: ['casey', 'drew', 'jade'] },
      { label: 'Volleyball', values: ['drew', 'glen', 'jade'] },
    ],
    {
      label: 'Sports',
    }
  ),
  options: {},
};
Alternative data structure
const config = {
  type: 'venn',
  data: {
    labels: [
      'Soccer',
      'Tennis',
      'Volleyball',
      'Soccer ∩ Tennis',
      'Soccer ∩ Volleyball',
      'Tennis ∩ Volleyball',
      'Soccer ∩ Tennis ∩ Volleyball',
    ],
    datasets: [
      {
        label: 'Sports',
        data: [
          { sets: ['Soccer'], value: 2 },
          { sets: ['Tennis'], value: 0 },
          { sets: ['Volleyball'], value: 1 },
          { sets: ['Soccer', 'Tennis'], value: 1 },
          { sets: ['Soccer', 'Volleyball'], value: 0 },
          { sets: ['Tennis', 'Volleyball'], value: 1 },
          { sets: ['Soccer', 'Tennis', 'Volleyball'], value: 1 },
        ],
      },
    ],
  },
  options: {},
};
ArcSlice elements have the basic backgroundColor, borderColor, and borderWidth properties similar to a regular rectangle.
The x scale ticks options are used to configure the set value labels within the intersections.
The y scale ticks options are used to configure the set label labels next ot the set circles.
Changing the tick display options (e.g. scales.x.ticks.display = false) will disable the set value labels.
Similarly, its font spec and color are used to the styling of the labels.
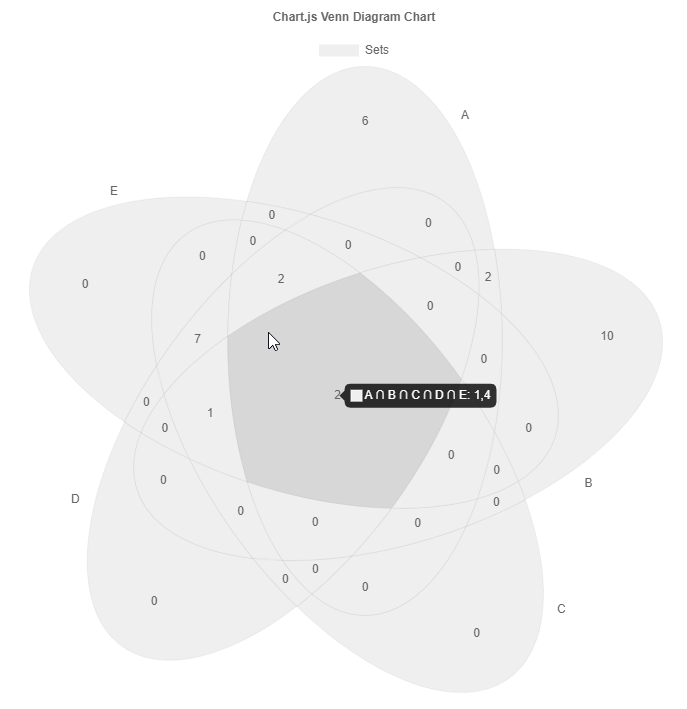
Euler diagrams are relaxed proportional venn diagrams such that the area of the circles and overlap try to fit the overlapping value. It is a relaxed in a way that is just approximates the proportions using a numerical optimization process. Moreover, only one and two set overlaps are used for the computation. The library uses venn.js in the background.
const config = {
  type: 'euler',
  data: ChartVenn.extractSets(
    [
      { label: 'A', values: [1, 2, 3, 4, 11, 12, 13, 14, 15, 16, 17, 18] },
      { label: 'B', values: [1, 2, 3, 4, 5, 6, 7, 8, 9, 10, 19, 20, 21, 22, 23] },
      { label: 'C', values: [1, 11, 12, 4, 5, 24, 25, 26, 27, 28, 29, 30] },
    ],
    {
      label: 'Sets',
    }
  ),
  options: {},
};
see Venn Diagram
The ESM build of the library supports tree shaking thus having no side effects. As a consequence the chart.js library won't be automatically manipulated nor new controllers automatically registered. One has to manually import and register them.
Variant A:
import { Chart, LinearScale } from 'chart.js';
import { VennDiagramController, ArcSlice } from 'chartjs-chart-venn';

Chart.register(VennDiagramController, ArcSlice, LinearScale);
...

new Chart(ctx, {
  type: VennDiagramController.id,
  data: [...],
});
Variant B:
import { VennDiagramChart } from 'chartjs-chart-venn';

new VennDiagramChart(ctx, {
  data: [...],
});
npm i -g yarn
yarn install
yarn sdks vscode
yarn compile
yarn test
yarn lint
yarn fix
yarn build
yarn docs
FAQs
Chart.js module for venn diagrams
The npm package chartjs-chart-venn receives a total of 4,687 weekly downloads. As such, chartjs-chart-venn popularity was classified as popular.
We found that chartjs-chart-venn demonstrated a healthy version release cadence and project activity because the last version was released less than a year ago. It has 1 open source maintainer collaborating on the project.
Did you know?

Socket for GitHub automatically highlights issues in each pull request and monitors the health of all your open source dependencies. Discover the contents of your packages and block harmful activity before you install or update your dependencies.
Product
Socket for Jira lets teams turn alerts into Jira tickets with manual creation, automated ticketing rules, and two-way sync.

Company News
Socket won two 2026 Reppy Awards from RepVue, ranking in the top 5% of all sales orgs. AE Alexandra Lister shares what it's like to grow a sales career here.

Security News
NIST will stop enriching most CVEs under a new risk-based model, narrowing the NVD's scope as vulnerability submissions continue to surge.