Security News
Crates.io Users Targeted by Phishing Emails
The Rust Security Response WG is warning of phishing emails from rustfoundation.dev targeting crates.io users.
By Sarah Gooding - Sep 12, 2025
chartjs-plugin-labels
Advanced tools
Chart.js plugin to display labels on pie, doughnut and polar area chart.
Chart.js plugin to display labels on pie, doughnut and polar area chart. Original Chart.PieceLabel.js
You can also install chartjs-plugin-labels by using Bower.
bower install chartjs-plugin-labels
Or node.js, you can use this command to install:
npm install chartjs-plugin-labels
v1.0.0 has breaking changes. Please see CHANGELOG v1.0.0
v0.7.0 has deprecated options. Please see CHANGELOG v0.7.0
v0.4.0 has breaking changes. Please see CHANGELOG v0.4.0
JavaScript
new Chart(ctx, {
  type: type,
  data: data,
  options: {
    plugins: {
      labels: {
        // render 'label', 'value', 'percentage', 'image' or custom function, default is 'percentage'
        render: 'value',

        // precision for percentage, default is 0
        precision: 0,

        // identifies whether or not labels of value 0 are displayed, default is false
        showZero: true,

        // font size, default is defaultFontSize
        fontSize: 12,

        // font color, can be color array for each data or function for dynamic color, default is defaultFontColor
        fontColor: '#fff',

        // font style, default is defaultFontStyle
        fontStyle: 'normal',

        // font family, default is defaultFontFamily
        fontFamily: "'Helvetica Neue', 'Helvetica', 'Arial', sans-serif",

        // draw text shadows under labels, default is false
        textShadow: true,

        // text shadow intensity, default is 6
        shadowBlur: 10,

        // text shadow X offset, default is 3
        shadowOffsetX: -5,

        // text shadow Y offset, default is 3
        shadowOffsetY: 5,

        // text shadow color, default is 'rgba(0,0,0,0.3)'
        shadowColor: 'rgba(255,0,0,0.75)',

        // draw label in arc, default is false
        // bar chart ignores this
        arc: true,

        // position to draw label, available value is 'default', 'border' and 'outside'
        // bar chart ignores this
        // default is 'default'
        position: 'default',

        // draw label even it's overlap, default is true
        // bar chart ignores this
        overlap: true,

        // show the real calculated percentages from the values and don't apply the additional logic to fit the percentages to 100 in total, default is false
        showActualPercentages: true,

        // set images when `render` is 'image'
        images: [
          {
            src: 'image.png',
            width: 16,
            height: 16
          }
        ],

        // add padding when position is `outside`
        // default is 2
        outsidePadding: 4,

        // add margin of text when position is `outside` or `border`
        // default is 2
        textMargin: 4
      }
    }
  }
});

// custom render
{
  render: function (args) {
    // args will be something like:
    // { label: 'Label', value: 123, percentage: 50, index: 0, dataset: {...} }
    return '$' + args.value;

    // return object if it is image
    // return { src: 'image.png', width: 16, height: 16 };
  }
}

// dynamic fontColor
{
  fontColor: function (args) {
    // args will be something like:
    // { index: 0, dataset: {...} }
    return myColorTransfer(args.dataset.backgroundColor[index]);
  }
}
Support multiple options, eg.
labels: [
  {
    render: 'label',
    position: 'outside'
  },
  {
    render: 'value'
  }
]
Global options
Chart.defaults.global.plugins.labels = {
  // ...
};
If you use angular2-chartjs, you can import by this:
import { ChartModule } from 'angular2-chartjs';
import 'chartjs-plugin-labels';
The project is released under the MIT license.
The project's website is located at https://github.com/emn178/chartjs-plugin-labels
Author: Chen, Yi-Cyuan (emn178@gmail.com)
v1.1.0 / 2018-09-24
FAQs
Chart.js plugin to display labels on pie, doughnut and polar area chart.
The npm package chartjs-plugin-labels receives a total of 15,487 weekly downloads. As such, chartjs-plugin-labels popularity was classified as popular.
We found that chartjs-plugin-labels demonstrated a not healthy version release cadence and project activity because the last version was released a year ago. It has 1 open source maintainer collaborating on the project.
Did you know?

Socket for GitHub automatically highlights issues in each pull request and monitors the health of all your open source dependencies. Discover the contents of your packages and block harmful activity before you install or update your dependencies.
Security News
The Rust Security Response WG is warning of phishing emails from rustfoundation.dev targeting crates.io users.
Product
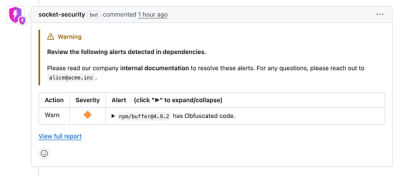
Socket now lets you customize pull request alert headers, helping security teams share clear guidance right in PRs to speed reviews and reduce back-and-forth.

Product
Socket's Rust support is moving to Beta: all users can scan Cargo projects and generate SBOMs, including Cargo.toml-only crates, with Rust-aware supply chain checks.