Research
/Security News
Critical Vulnerability in NestJS Devtools: Localhost RCE via Sandbox Escape
A flawed sandbox in @nestjs/devtools-integration lets attackers run code on your machine via CSRF, leading to full Remote Code Execution (RCE).
chartsonmap
Advanced tools
此库使用ArcGIS API for JavaScript 3.14版本(其他版本未测试,不支持4.0版本)与ECharts,扩展了AGS API ,实现了像在ArcMap中制作统计专题图的效果。


var dojoConfig = {
packages: [{
name: "CustomModules",
location: location.pathname.replace(/\/[^/]+$/, "") + "/Widget/CustomModules"
}]
};
Widget/CustomModules/ChartInfoWindow中的ChartInfoWindow.js 和 geometryUtils.js,require(["CustomModules/ChartInfoWindow",
"CustomModules/geometryUtils"], function(ChartInfoWindow, geometryUtils){
#Coding Here...
})
require(["CustomModules/ChartInfoWindow",
         "CustomModules/geometryUtils"], function(ChartInfoWindow, geometryUtils){
            #Coding Here...
            #数据处理好之后,处理每一个要素形成一个图标框
            var infoWindow= new ChartInfoWindow({
                /*mainMap -Required*/map:map,
                /*chartNode -Required*/chart: nodeChart,
                /*(x,y,spatialreference) -Required*/chartPoint: labelPt,
                /*float -Optional*/width: 152,
                /*float -Optional*/height: 72
            });
         })
FAQs
Charts On Map
We found that chartsonmap demonstrated a not healthy version release cadence and project activity because the last version was released a year ago. It has 1 open source maintainer collaborating on the project.
Did you know?

Socket for GitHub automatically highlights issues in each pull request and monitors the health of all your open source dependencies. Discover the contents of your packages and block harmful activity before you install or update your dependencies.

Research
/Security News
A flawed sandbox in @nestjs/devtools-integration lets attackers run code on your machine via CSRF, leading to full Remote Code Execution (RCE).

Product
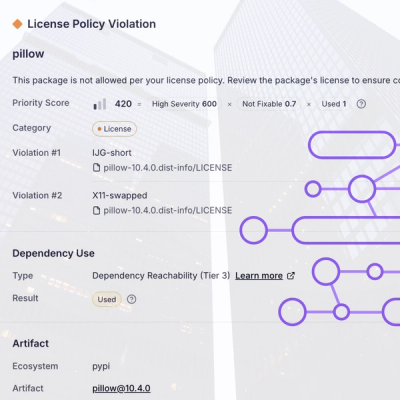
Customize license detection with Socket’s new license overlays: gain control, reduce noise, and handle edge cases with precision.

Product
Socket now supports Rust and Cargo, offering package search for all users and experimental SBOM generation for enterprise projects.