Security News
PodRocket Podcast: Inside the Recent npm Supply Chain Attacks
Socket CEO Feross Aboukhadijeh discusses the recent npm supply chain attacks on PodRocket, covering novel attack vectors and how developers can protect themselves.
Pure JS library for making scatter plots in the terminal with braille dots
function plot(
x: number[],
y: number[],
options?: Options,
): string;
interface Options {
// minimum x value on plot
xmin?: number;
// maximum x value on plot
xmax?: number;
// minimum y value on plot
ymin?: number;
// maximum y value on plot
ymax?: number;
// width of plot in terminal characters [80]
width?: number;
// height of plot in terminal characters [24]
height?: number;
// whether to draw the x-axis as a line of hyphens [false]
xaxis?: boolean;
// whether to draw the y-axis as a line of bars [false]
yaxis?: boolean;
// whether to draw the origin as a '+' [false]
origin?: boolean;
// whether to draw a rectangle around the entire plot [false]
border?: boolean;
// number of x-axis labels to display (default 0)
xlabels?: number;
// number of y-axis labels to display (default 0)
ylabels?: number;
// plot title centered on top line
title?: string;
// name for x axis, printed on bottom of chart
xname?: string;
// name for y axis, printed vertically on left edge
yname?: string
}
Vertical text is added as appropriate for x-tick labels or y-axis name by stacking characters on top of each other. Labels will all cut into the width/height dimensions of the chart, so it is recommended to use larger than the default if including labels.
Actually drawing the axes has the significant drawback that it will be impossible to draw dots on the same character as the axis lines.
The actual scatter plot is done with Braille characters, so that each character in the string can plot up to 8 different points, in a 4 (high) by 2 (wide) grid. If multiple points fall onto the same dot, it is still only drawn once - there is no way to represent more than one point in a single dot.
FAQs
Pure JS library for making scatter plots in the terminal with braille dots
We found that chartty demonstrated a healthy version release cadence and project activity because the last version was released less than a year ago. It has 1 open source maintainer collaborating on the project.
Did you know?

Socket for GitHub automatically highlights issues in each pull request and monitors the health of all your open source dependencies. Discover the contents of your packages and block harmful activity before you install or update your dependencies.

Security News
Socket CEO Feross Aboukhadijeh discusses the recent npm supply chain attacks on PodRocket, covering novel attack vectors and how developers can protect themselves.

Security News
Maintainers back GitHub’s npm security overhaul but raise concerns about CI/CD workflows, enterprise support, and token management.

Product
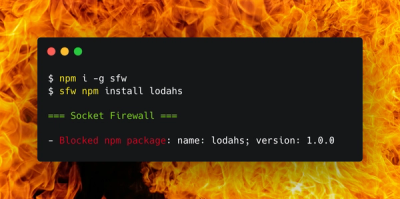
Socket Firewall is a free tool that blocks malicious packages at install time, giving developers proactive protection against rising supply chain attacks.