Security News
Package Maintainers Call for Improvements to GitHub’s New npm Security Plan
Maintainers back GitHub’s npm security overhaul but raise concerns about CI/CD workflows, enterprise support, and token management.
cloudwatch-metrics
Advanced tools
This module provides a simplified wrapper for creating and publishing CloudWatch metrics.
$ npm install cloudwatch-metrics
or
$ npm install cloudwatch-metrics --save
By default, the library will log metrics to the us-east-1 region and read
AWS credentials from the AWS SDK's default environment variables.
If you want to change these values, you can call initialize:
var cloudwatchMetrics = require('cloudwatch-metrics');
cloudwatchMetrics.initialize({
	region: 'us-east-1'
});
For creating a metric, we simply need to provide the namespace and the default type of metric:
var myMetric = new cloudwatchMetrics.Metric('namespace', 'Count');
If we want to add our own default dimensions, such as environment information, we can add it in the following manner:
var myMetric = new cloudwatchMetrics.Metric('namespace', 'Count', [{
	Name: 'environment',
	Value: 'PROD'
}]);
If we want to disable a metric in certain environments (such as local development), we can make the metric in the following manner:
// isLocal is a boolean
var isLocal = someWayOfDetermingIfLocal();

var myMetric = new cloudwatchMetrics.Metric('namespace', 'Count', [{
	Name: 'environment',
	Value: 'PROD'
}], {
	enabled: isLocal
});
The full list of configuration options is:
| Option | Purpose |
|---|---|
| enabled | Whether or not we should send the metric to CloudWatch (useful for dev vs prod environments). |
| sendInterval | The interval in milliseconds at which we send any buffered metrics, defaults to 5000 milliseconds. |
| sendCallback | A callback to be called when we send metric data to CloudWatch (useful for logging any errors in sending data). |
| maxCapacity | A maximum number of events to buffer before we send immediately (before the sendInterval is reached). |
| withTimestamp | Include the timestamp with the metric value. |
| storageResolution | The metric storage resolution to use in seconds. Set to 1 for high resolution metrics. See (https://aws.amazon.com/blogs/aws/new-high-resolution-custom-metrics-and-alarms-for-amazon-cloudwatch/) |
Then, whenever we want to publish a metric, we simply do:
myMetric.put(value, metric, units, additionalDimensions);
Instead of sending individual data points for your metric, you may want to send
summary metrics. Summary metrics track statistics over time, and send those
statistics to CloudWatch on a configurable interval. For instance, you might
want to know your total network throughput, but you don't care about individual
request size percentiles. You could use summaryPut to track this data and send
it to CloudWatch with fewer requests:
var metric = new cloudwatchMetrics.Metric('namespace', 'Bytes');

function onRequest(req) {
	// This will still track maximum, minimum, sum, count, and average, but won't
	// take up lots of CloudWatch requests doing so.
	metric.summaryPut(req.size, 'requestSize');
}
Note that metrics use different summaries for different dimensions, and that the order of the dimensions is significant! In other words, these track different metric sets:
var metric = new cloudwatchMetrics.Metric('namespace', 'Bytes');
// Different statistic sets!
metric.summaryPut(45, 'requestSize', [{Name: 'Region', Value: 'US'}, {Name: 'Server', Value: 'Card'}]);
metric.summaryPut(894, 'requestSize', [{Name: 'Server', Value: 'Card'}, {Name: 'Region', Value: 'US'}]);
Be aware that the put call does not actually send the metric to CloudWatch
at that moment. Instead, it stores unsent metrics and sends them to
CloudWatch on a predetermined interval (to help get around sending too many
metrics at once - CloudWatch limits you by default to 150 put-metric data
calls per second). The default interval is 5 seconds, if you want metrics
sent at a different interval, then provide that option when constructing your
CloudWatch Metric:
var myMetric = new cloudwatchMetrics.Metric('namespace', 'Count', [{
	Name: 'environment',
	Value: 'PROD'
}], {
	sendInterval: 3 * 1000 // It's specified in milliseconds.
});
You can also register a callback to be called when we actually send metrics to CloudWatch - this can be useful for logging put-metric-data errors:
var myMetric = new cloudwatchMetrics.Metric('namespace', 'Count', [{
	Name: 'environment',
	Value: 'PROD'
}], {
	sendCallback: (err) => {
		if (!err) return;
		// Do your error handling here.
	}
});
GH_TOKEN=xxx npx semantic-release --no-ci
FAQs
A simple wrapper for simplifying using Cloudwatch metrics
The npm package cloudwatch-metrics receives a total of 30,680 weekly downloads. As such, cloudwatch-metrics popularity was classified as popular.
We found that cloudwatch-metrics demonstrated a not healthy version release cadence and project activity because the last version was released a year ago. It has 33 open source maintainers collaborating on the project.
Did you know?

Socket for GitHub automatically highlights issues in each pull request and monitors the health of all your open source dependencies. Discover the contents of your packages and block harmful activity before you install or update your dependencies.

Security News
Maintainers back GitHub’s npm security overhaul but raise concerns about CI/CD workflows, enterprise support, and token management.

Product
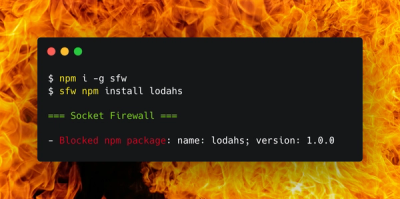
Socket Firewall is a free tool that blocks malicious packages at install time, giving developers proactive protection against rising supply chain attacks.

Research
Socket uncovers malicious Rust crates impersonating fast_log to steal Solana and Ethereum wallet keys from source code.