
Security News
Crates.io Users Targeted by Phishing Emails
The Rust Security Response WG is warning of phishing emails from rustfoundation.dev targeting crates.io users.
By Sarah Gooding - Sep 12, 2025
_______ _______ ___ ___ _______ _______ _______ _______
| _ | _ | Y | _ | | _ | |
|. 1___|. 1 |. | | 1___|.| | |. 1 |.| | |
|. |___|. ____|. | |____ `-|. |-|. _ `-|. |-'
|: 1 |: | |: 1 |: 1 | |: | |: | | |: |
|::.. . |::.| |::.. . |::.. . | |::.| |::.|:. | |::.|
`-------`---' `-------`-------' `---' `--- ---' `---'
Note: This repo can be found on npm here: cpu-stat
Note: This repo can be found on github here: node-cpu-stat
Note: This module only relies on the os module, so it should be compatible on all OS's where Node.js runs.
npm install cpu-stat
var cpuStat = require('cpu-stat');
//by default returns cpu usage percent for all cores over a period of the next 1000ms
cpuStat.usagePercent(function(err, percent, seconds) {
    if (err) {
      return console.log(err);
    }

    //the percentage cpu usage over all cores
    console.log(percent);

    //the approximate number of seconds the sample was taken over
    console.log(seconds);
});
//get the cpu usage percent for core 0 over a sample period of 2000ms
cpuStat.usagePercent({
    coreIndex: 0,
    sampleMs: 2000,
  },
  function(err, percent, seconds) {
    if (err) {
      return console.log(err);
    }

    //the percentage cpu usage for core 0
    console.log(percent);

    //the approximate number of seconds the sample was taken over
    console.log(seconds);
});
//get the total number of cores
var totalCores = cpuStat.totalCores();
console.log(totalCores);
//get the average clock MHz over all cores
var avgClockMHz = cpuStat.avgClockMHz();
console.log(avgClockMHz);
//get the clock MHz for core with index 2
var avgClockMHzCore2 = cpuStat.clockMHz(2);
console.log(avgClockMHzCore2);
Provides a callback cb(err, percent, seconds) giving the percent cpu usage and seconds the length of the sample time, or an error err
| Option | Type | Default | Explanation |
|---|---|---|---|
| opts | Object | see below | Options object, specify what you need the defaults will be filled in |
| opts.coreIndex | Number | all cores | The index of the core to calculate the usage on. Can use any coreIndex such that 0 >= coreIndex < memStat.totalCores() |
| opts.sampleMs | String | 1000 | sampleMs is the amount of time to take the measurement over |
| cb | Function | none | Callback which has signature cb(err, percent, seconds) |
Returns the total number of cores available on the cpu
Returns the clock speed in MHz of core with index coreIndex
Returns the average clock speed in MHz over all cores
Just send a PR, or create an issue if you are not sure.
Areas ripe for contribution:
Note: net-stat, disk-stat, mem-stat only work on nix platforms.
MIT
FAQs
CPU Statistics not provided by `os` module
The npm package cpu-stat receives a total of 978 weekly downloads. As such, cpu-stat popularity was classified as not popular.
We found that cpu-stat demonstrated a not healthy version release cadence and project activity because the last version was released a year ago. It has 1 open source maintainer collaborating on the project.
Did you know?

Socket for GitHub automatically highlights issues in each pull request and monitors the health of all your open source dependencies. Discover the contents of your packages and block harmful activity before you install or update your dependencies.
Security News
The Rust Security Response WG is warning of phishing emails from rustfoundation.dev targeting crates.io users.
Product
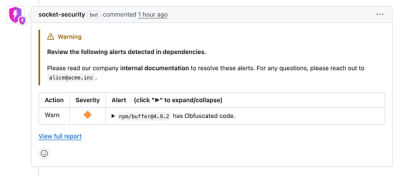
Socket now lets you customize pull request alert headers, helping security teams share clear guidance right in PRs to speed reviews and reduce back-and-forth.

Product
Socket's Rust support is moving to Beta: all users can scan Cargo projects and generate SBOMs, including Cargo.toml-only crates, with Rust-aware supply chain checks.