
Security News
Crates.io Users Targeted by Phishing Emails
The Rust Security Response WG is warning of phishing emails from rustfoundation.dev targeting crates.io users.
By Sarah Gooding - Sep 12, 2025


Dailychart.js is a tiny standalone SVG charting library to display daily graph of a stock market security. Try the demo.
The simplest way is to include the library file from CDN:
<script src='https://unpkg.com/dailychart/dist/dailychart.min.js'></script>
It's also possible to install the package as a dependency from NPM
npm install dailychart --save
then include the library into your project:
var Dailychart = require('dailychart');
First, create a container for the chart and fill with data using attributes.
data-dailychart-values (required) - comma-separated values for the chart.data-dailychart-close - the value splits the chart on two areas (positive, negative) with its own colors.data-dailychart-length - the total number of data points. Used to scale the chart along the horizontal axis. If data-dailychart-values has fewer points the remaining space will be empty. On the other hand, if data-dailychart-length isn't defined the chart will fit the container.<div id="chart"
data-dailychart-values="12.94,13.0,12.98,13.02,13.0,13.0,12.95,12.85,13.04,13.13"
data-dailychart-close="13.08"
data-dailychart-length="78">
</div>
Optionally apply CSS to the container.
#chart {
  width: 80px;
  height: 30px;
}
Finally, create the chart for the element.
Dailychart.create('#chart', { lineWidth: 2 });
The first parameter can be a HTML element, a list of HTML elements or a CSS selector string.
The second parameter of the constructor is an object that contains the number of options to control the appearance of the chart.
width - Chart width. If not set it equals to container's width.height - Chart height. If not set it equals to container's height.lineWidth - Line width of the graph (default: 1).colorPositive - Color of the positive part of the graph (default: '#33AE45').colorNegative - Color of the negative part of the graph (default: '#EB5757').fillPositive - Fill color of the positive area (default: '').fillNegative - Fill color of the negative area (default: '').closeWidth - Width of the close line (default: 1).closeColor - Color of the close line (default: '#e0e0e0').Dailychart.js is available under the MIT License.
FAQs
Tiny SVG charting library to display stock sparklines
We found that dailychart demonstrated a not healthy version release cadence and project activity because the last version was released a year ago. It has 1 open source maintainer collaborating on the project.
Did you know?

Socket for GitHub automatically highlights issues in each pull request and monitors the health of all your open source dependencies. Discover the contents of your packages and block harmful activity before you install or update your dependencies.
Security News
The Rust Security Response WG is warning of phishing emails from rustfoundation.dev targeting crates.io users.
Product
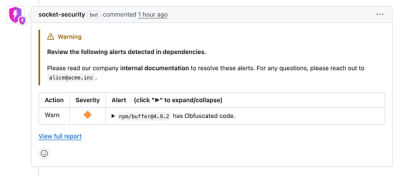
Socket now lets you customize pull request alert headers, helping security teams share clear guidance right in PRs to speed reviews and reduce back-and-forth.

Product
Socket's Rust support is moving to Beta: all users can scan Cargo projects and generate SBOMs, including Cargo.toml-only crates, with Rust-aware supply chain checks.