Product
Socket for Jira Is Now Available
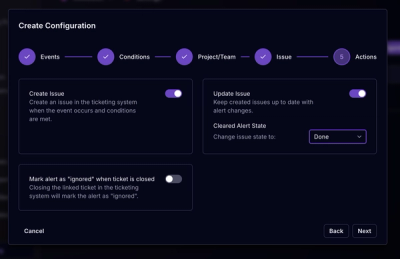
Socket for Jira lets teams turn alerts into Jira tickets with manual creation, automated ticketing rules, and two-way sync.
By Jeppe Hasseriis - Apr 20, 2026
datadog-metrics
Advanced tools
Buffered metrics reporting via the Datadog HTTP API.

![]()

Datadog-metrics lets you collect application metrics through Datadog's HTTP API. Using the HTTP API has the benefit that you don't need to install the Datadog Agent (StatsD). Just get an API key, install the module and you're ready to go.
The downside of using the HTTP API is that it can negatively affect your app's performance. Datadog-metrics solves this issue by buffering metrics locally and periodically flushing them to Datadog.
Datadog-metrics is compatible with Node.js v12 and later. You can install it with NPM:
npm install datadog-metrics --save

Save the following into a file named example_app.js:
var metrics = require('datadog-metrics');
metrics.init({ host: 'myhost', prefix: 'myapp.' });

function collectMemoryStats() {
    var memUsage = process.memoryUsage();
    metrics.gauge('memory.rss', memUsage.rss);
    metrics.gauge('memory.heapTotal', memUsage.heapTotal);
    metrics.gauge('memory.heapUsed', memUsage.heapUsed);
};

setInterval(collectMemoryStats, 5000);
Run it:
DATADOG_API_KEY=YOUR_KEY DEBUG=metrics node example_app.js
There's also a longer tutorial that walks you through setting up a monitoring dashboard on Datadog using datadog-metrics.
Make sure the DATADOG_API_KEY or DD_API_KEY environment variable is set to your Datadog API key (you can also set it via the apiKey option in code). You can find the API key under Integrations > APIs. Please note the API key is different from an application key. For more details, see Datadog’s “API and Application Keys” docs.
There are three ways to use this module to instrument an application. They differ in the level of control that they provide.
Just require datadog-metrics and you're ready to go. After that you can call
gauge, increment and histogram to start reporting metrics.
var metrics = require('datadog-metrics');
metrics.gauge('mygauge', 42);
If you want more control you can configure the module with a call to init.
Make sure you call this before you use the gauge, increment and histogram
functions. See the documentation for init below to learn more.
var metrics = require('datadog-metrics');
metrics.init({ host: 'myhost', prefix: 'myapp.' });
metrics.gauge('mygauge', 42);
If you need even more control you can create one or more BufferedMetricsLogger instances and manage them yourself:
var metrics = require('datadog-metrics');
var metricsLogger = new metrics.BufferedMetricsLogger({
    site: 'datadoghq.eu',
    apiKey: 'TESTKEY',
    host: 'myhost',
    prefix: 'myapp.',
    flushIntervalSeconds: 15,
    defaultTags: ['env:staging', 'region:us-east-1'],
    onError (error) {
        console.error('There was an error auto-flushing metrics:', error);
    }
});
metricsLogger.gauge('mygauge', 42);
metrics.init(options)
Where options is an object and can contain the following:
host: Sets the hostname reported with each metric. (optional)
prefix: Sets a default prefix for all metrics. (optional)
flushIntervalSeconds: How often to send metrics to Datadog. (optional)
0 to disable auto-flushing (which
means you must call flush() manually).site: Sets the Datadog "site", or server where metrics are sent. (optional)
datadoghq.com.DATADOG_SITE or DD_SITE environment variable.reporter option.apiKey: Sets the Datadog API key. (optional)
DATADOG_API_KEY or
DD_API_KEY environment variable by default.reporter option.appKey: ⚠️ Deprecated. This does nothing and will be removed in an upcoming
release.
Sets the Datadog application key. This is not actually needed for sending metrics or distributions, and you probably shouldn’t set it. Do not confuse this with your API key! For more, see: https://docs.datadoghq.com/account_management/api-app-keys/
defaultTags: Default tags used for all metric reporting. (optional)
onError: A function to call when there are asynchronous errors seding
buffered metrics to Datadog. It takes one argument (the error). (optional)
histogram: An object with default options for all histograms. This has the
same properties as the options object on the histogram() method. Options
specified when calling the method are layered on top of this object.
(optional)
retries: How many times to retry failed metric submissions to Datadog’s API.
2.reporter option.retryBackoff: How long to wait before retrying a failed Datadog API call.
Subsequent retries multiply this delay by 2^(retry count). For example, if
this is set to 1, retries will happen after 1, then 2, then 4 seconds.
1.reporter option.reporter: An object that actually sends the buffered metrics. (optional)
reporters.DatadogReporter sends metrics to Datadog’s API, and is
the default.reporters.NullReporter throws the metrics away. It’s useful for
tests or temporarily disabling your metrics.Example:
metrics.init({ host: 'myhost', prefix: 'myapp.' });
Disabling metrics using NullReporter:
metrics.init({ host: 'myhost', reporter: metrics.NullReporter() });
Send metrics to a totally different service instead of Datadog:
metrics.init({
  reporter: {
    async report(series) {
      // `series` is an array of metrics objects, formatted basically how the
      // Datadog v1 metrics API and v1 distributions API want them.
      const response = await fetch('https://my-datadog-like-api.com/series', {
        method: 'POST',
        body: JSON.stringify({ series })
      });
      return await response.json();
    }
  }
});
metrics.gauge(key, value[, tags[, timestamp]])
Record the current value of a metric. The most recent value since the last
flush will be recorded. Optionally, specify a set of tags to associate with the
metric. This should be used for sum values such as total hard disk space,
process uptime, total number of active users, or number of rows in a database
table. The optional timestamp is in milliseconds since 1 Jan 1970 00:00:00 UTC,
e.g. from Date.now().
Example:
metrics.gauge('test.mem_free', 23);
metrics.increment(key[, value[, tags[, timestamp]]])
Increment the counter by the given value (or 1 by default). Optionally,
specify a list of tags to associate with the metric. This is useful for
counting things such as incrementing a counter each time a page is requested.
The optional timestamp is in milliseconds since 1 Jan 1970 00:00:00 UTC,
e.g. from Date.now().
Example:
metrics.increment('test.requests_served');
metrics.increment('test.awesomeness_factor', 10);
metrics.histogram(key, value[, tags[, timestamp[, options]]])
Sample a histogram value. Histograms will produce metrics that
describe the distribution of the recorded values, namely the minimum,
maximum, average, median, count and the 75th, 85th, 95th and 99th percentiles.
Optionally, specify a list of tags to associate with the metric.
The optional timestamp is in milliseconds since 1 Jan 1970 00:00:00 UTC,
e.g. from Date.now().
Example:
metrics.histogram('test.service_time', 0.248);
You can also specify an options object to adjust which aggregations and percentiles should be calculated. For example, to only calculate an average, count, and 99th percentile:
metrics.histogram('test.service_time', 0.248, ['tag:value'], Date.now(), {
    // Aggregates can include 'max', 'min', 'sum', 'avg', 'median', or 'count'.
    aggregates: ['avg', 'count'],
    // Percentiles can include any decimal between 0 and 1.
    percentiles: [0.99]
});
metrics.distribution(key, value[, tags[, timestamp]])
Send a distribution value. Distributions are similar to histograms (they create several metrics for count, average, percentiles, etc.), but they are calculated server-side on Datadog’s systems. This is much higher-overhead than histograms, and the individual calculations made from it have to be configured on the Datadog website instead of in the options for this package.
You should use this in environments where you have many instances of your
application running in parallel, or instances constantly starting and stopping
with different hostnames or identifiers and tagging each one separately is not
feasible. AWS Lambda or serverless functions are a great example of this. In
such environments, you also might want to use a distribution instead of
increment or gauge (if you have two instances of your app sending those
metrics at the same second, and they are not tagged differently or have
different host names, one will overwrite the other — distributions will not).
Example:
metrics.distribution('test.service_time', 0.248);
By default, datadog-metrics will automatically flush, or send accumulated
metrics to Datadog, at regular intervals, and, in environments that support it,
before your program exits. (However, if you call process.exit() to cause a
hard exit, datadog-metrics doesn’t get a chance to flush. In this case, you may
want to call await metrics.stop() first.)
You can adjust the interval by using the flushIntervalSeconds option. Setting
it to 0 will disable auto-flushing entirely:
// Set auto-flush interval to 10 seconds.
metrics.init({ flushIntervalSeconds: 10 });
You can also send accumulated metrics manually at any time by calling
metrics.flush().
Please note that, when calling the BufferedMetricsLogger constructor directly,
flushIntervalSeconds defaults to 0 instead. When constructing your own
logger this way, you must expicitly opt-in to auto-flushing by setting a
positive value.
metrics.flush()Sends any buffered metrics to Datadog and returns a promise. By default,
flush() will be called for you automatically unless you set
flushIntervalSeconds to 0 (see above for more details).
⚠️ This method used to take two callback arguments for handling successes and errors. That form is deprecated and will be removed in a future update:
// Deprecated:
metrics.flush(
    () => console.log('Flush suceeded!'),
    (error) => console.log('Flush error:', error)
);

// Current, using `await`:
try {
    await metrics.flush();
    console.log('Flush suceeded!');
} catch (error) {
    console.log('Flush error:', error);
}

// Or, using Promise callbacks:
metrics.flush()
    .then(() => console.log('Flush succeeded'))
    .catch((error) => console.log('Flush error:', error)) ;
metrics.stop(options)Stops auto-flushing (if enabled) and flushes any currently buffered metrics.
This is mainly useful if you want to manually clean up and send remaining
metrics before hard-quitting your program (usually by calling process.exit()).
Returns a promise for the result of the flush.
Takes an optional object with properties:
flush (boolean) Whether to flush any remaining metrics after stopping.
Defaults to true.Datadog-metrics uses the debug
library for logging at runtime. You can enable debug logging by setting
the DEBUG environment variable when you run your app.
Example:
DEBUG=metrics node app.js
Contributions are always welcome! For more info on how to contribute or develop locally, please see CONTRIBUTING.md.
New Features:
When auto-flushing is enabled, metrics are now also flushed before the process exits. In previous versions, you needed to do this manually by calling metrics.flush() at the every end of your program. (#141)
You will still need to flush manually if you set flushIntervalSeconds to 0 or stop() (see below) if you are quitting your program by calling process.exit() (which interrupts a variety of operations).
A new stop() method disables auto-flushing and flushes any currently buffered metrics (you can leave metrics in the buffer instead with the flush option: stop({flush: false})). (#141)
Datadog-metrics now automatically retries failed metric submissions and uses promises for asynchronous actions! There are a handful of other deprecations and small improvements.
Breaking Changes:
DatadogReporter constructor now takes an options object instead of positional arguments. Using this constructor directly is pretty rare, so this won’t affect most users. (#138)New Features:
Promises: asynchronous actions now use promises instead of callbacks. Callbacks are deprecated, but still work — they’ll be fully removed in v0.13.0. This affects:
flush() method now returns a promise.report(series) method on any custom reporters should now return a promise. For now, datadog-metrics will use the old callback-based behavior if the method signature has callbacks listed after series argument.(See #125)
Retries: flushes to Datadog’s API are now retried automatically. This can help you work around intermittent network issues or rate limits. To adjust retries, use the retries and retryBackoff options.
metrics.init({
    // How many times to retry. To disable retries, set this to 0.
    retries: 2,
    // How long (in seconds) to wait between retries. Subsequent retries
    // wait exponentially longer.
    retryBackoff: 1
});
(See #138)
Environment variables: you can now use either DATADOG_ or DD_ prefixes for environment variables (previously, only DATADOG_ worked). For example, you can set your API key via DATADOG_API_KEY or DD_API_KEY. (#137)
Deprecations:
The appKey option is no longer supported. Application keys (as opposed to API keys) are not actually needed for sending metrics or distributions to the Datadog API. Including it in your configuration adds no benefits, but risks exposing a sensitive credential. (#127)
The DATADOG_API_HOST environment variable is now deprecated. Please use DATADOG_SITE or DD_SITE instead (the apiHost option was renamed to site in v0.11.0, but the DATADOG_API_HOST environment variable was accidentally left as-is). (#134)
This release updates the TypeScript types for this project, and doesn’t include any changes to functionality. There are also no changes since v0.11.4-a.1.
Bug Fixes:
BufferedMetricsLogger is now an actual class & type when you import it in TypeScript. That is, you can now do:
import { BufferedMetricsLogger } from 'datadog-metrics';

function useLogger(logger: BufferedMetricsLogger) {
    // ...
}
Previously, you would have had to declare the type for logger as typeof BufferedMetricsLogger.prototype. (#120)
This pre-release is meant for testing a fix for #119.
Bug Fixes:
BufferedMetricsLogger is seen as an actual class & type when importing in TypeScript. (#120)⚠️ No changes in this release since v0.11.2. This fixes a publishing error with v0.11.3a1.
⛔️ Do not use this release.
Fixes & Maintenance:
Fix types and documentation for the aggregates option for histograms and the histogram.aggregates option for the library as a whole. It was previously listed as aggregations, which was incorrect. (Thanks to @Calyhre in #117.)
Improve documentation and add a more detailed error message about API keys vs. application keys. (#118)
Fixes & Maintenance:
New Features:
Built-in TypeScript definitions. If you use TypeScript, you no longer need to install separate type definitions from @types/datadog-metrics — they’re now built-in. Please make sure to remove @types/datadog-metrics from your dev dependencies.
Even if you’re writing regular JavaScript, you should now see better autocomplete suggestions and documentation in editors that support TypeScript definitions (e.g. VisualStudio Code, WebStorm).
Breaking Changes:
class syntax internally. In most cases, you shouldn’t need to change anything. However, if you are calling BufferedMetricsLogger.apply(...) or BufferedMetricsLogger.call(...), you’ll need to change your code to use new BufferedMetricsLogger(...) instead.Deprecated Features:
The apiHost option has been renamed to site so that it matches up with Datadog docs and official packages. The old apiHost name still works for now, but will be removed in the future.
The reporters.DataDogReporter class has been renamed to reporters.DatadogReporter (lower-case D in "dog") so that it correctly matches Datadog’s actual name. The old name still works, but will be removed in the future.
This release includes several new features and bugfixes!
New Features:
Support for distribution metrics. You can now send distributions to Datadog by doing:
const metrics = require('datadog-metrics');
metrics.distribution('my.metric.name', 3.8, ['tags:here']);
Distributions are similar to histograms (they create several metrics for count, average, percentiles, etc.), but they are calculated server-side on Datadog’s systems. For more details and guidance on when to use them, see:
(Thanks to @Mr0grog.)
Add an onError option for handling asynchronous errors while flushing buffered metrics. You can use this to get details on an error or to send error info to a tracking service like Sentry.io:
const metrics = require('datadog-metrics');
metrics.init({
    onError (error) {
        console.error('There was an error sending to Datadog:', error);
    }
});
The built-in reporter classes are now available for you to use. If you need to disable the metrics library for some reason, you can now do so with:
const metrics = require('datadog-metrics');
metrics.init({
    reporter: new metrics.reporters.NullReporter(),
});
(Thanks to @Mr0grog.)
Add an option for setting histogram defaults. In v0.10.0, the histogram() function gained the ability to set what aggregations and percentiles it generates with a final options argument. You can now specify a histogram option for init() or BufferedMetricsLogger in order to set default options for all calls to histogram(). Any options you set in the actual histogram() call will layer on top of the defaults:
const metrics = require('datadog-metrics');
metrics.init({
    histogram: {
        aggregates: ['sum', 'avg'],
        percentiles: [0.99]
    }
});

// Acts as if the options had been set to:
// { aggregates: ['sum', 'avg'], percentiles: [0.99] }
metrics.histogram('my.metric.name', 3.8);

// Acts as if the options had been set to:
// { aggregates: ['sum', 'avg'], percentiles: [0.5, 0.95] }
metrics.histogram('my.metric.name', 3.8, [], Date.now(), {
    percentiles: [0.5, 0.95]
});
(Thanks to @Mr0grog.)
Add a .median aggregation for histograms. When you log a histogram metric, it ultimately creates several metrics that track the minimum value, average value, maximum value, etc. There is now one that tracks the median value. StatsD creates the same metric from histograms, so you may find this useful if transitioning from StatsD. (Thanks to @Mr0grog.)
This package no longer locks specific versions of its dependencies (instead, your package manager can choose any version that is compatible). This may help when deduplicating packages for faster installs or smaller bundles. (Thanks to @Mr0grog.)
Bug Fixes:
unref() on timers in non-Node.js environments. This is a step towards browser compatibility, although we are not testing browser-based usage yet. (Thanks to @Mr0grog.)apiHost option was broken in v0.10.0 and now works again. (Thanks to @Mr0grog and @npeters.)BufferedMetricsLogger will not longer change the credentials used by previously created BufferedMetricsLogger instances. (Thanks to @Mr0grog.)Internal Updates:
main. (Thanks to @dbader.)@datadog/datadog-api-client was not used correctly. (Thanks to @gquinteros93)Breaking change: we now use Datadog’s official @datadog/datadog-api-client package to send metrics to Datadog. This makes datadog-metrics usable with Webpack, but removes the agent option. If you were using this option and the new library does not provide a way to meet your needs, please let us know by filing an issue! (Thanks to @thatguychrisw)
You can now customize what metrics are generated by a histogram. When logging a histogram metric, the 5th argument is an optional object with information about which aggregations and percentiles to create metrics for:
const metrics = require('datadog-metrics');
metrics.histogram('my.metric.name', 3.8, [], Date.now(), {
    // Aggregates can include 'max', 'min', 'sum', 'avg', or 'count'.
    aggregates: ['max', 'min', 'sum', 'avg', 'count'],
    // Percentiles can include any decimal between 0 and 1.
    percentiles: [0.75, 0.85, 0.95, 0.99]
});
(Thanks to @gquinteros93.)
INTERNAL: Clean up continuous integration on TravisCI. (Thanks to @ErikBoesen.)
dogapi and jshint to their latest versions. (Thanks to @ErikBoesen.)Expose new apiHost option on init() and BufferedMetricsLogger constructor. This makes it possible to actually configure the Datadog site to submit metrics to. For example, you can now submit metrics to Datadog’s Europe servers with:
const metrics = require('datadog-metrics');
metrics.init({
    apiHost: 'datadoghq.eu'
});
(Thanks to @ErikBoesen.)
datadoghq.eu for Europe). (Thanks to @fermelone.)dogapi version.onSuccess callback in NullReporter. (Thanks to @dkMorlok.)counter to count as counter is deprecated by Datadog (Thanks to @dustingibbs)metrics.flush() (Thanks @akrylysov!)setDefaultXYZ() and added init()increment to be called with a default value of 1counter to incrementThis module is heavily inspired by the Python dogapi module.
Daniel Bader – @dbader_org – mail@dbader.org
Distributed under the MIT license. See LICENSE for more information.
Your contributions are always welcome! See CONTRIBUTING.md for more.
StatsD is a simple, lightweight network daemon that listens for metrics and aggregates them for transfer to a backend service like Graphite. It is similar to datadog-metrics in that it allows for the collection and aggregation of metrics, but it is more general-purpose and can be used with various backends.
Prom-client is a client for Prometheus, a popular open-source monitoring and alerting toolkit. It provides similar functionality to datadog-metrics, allowing developers to instrument their applications and collect metrics, but it is specifically designed to work with Prometheus.
New Relic is a comprehensive monitoring and observability platform. The newrelic npm package allows developers to instrument their Node.js applications and send metrics to New Relic. It offers similar functionality to datadog-metrics but is part of a broader suite of monitoring tools provided by New Relic.
FAQs
Buffered metrics reporting via the Datadog HTTP API
The npm package datadog-metrics receives a total of 2,754,538 weekly downloads. As such, datadog-metrics popularity was classified as popular.
We found that datadog-metrics demonstrated a not healthy version release cadence and project activity because the last version was released a year ago. It has 4 open source maintainers collaborating on the project.
Did you know?

Socket for GitHub automatically highlights issues in each pull request and monitors the health of all your open source dependencies. Discover the contents of your packages and block harmful activity before you install or update your dependencies.
Product
Socket for Jira lets teams turn alerts into Jira tickets with manual creation, automated ticketing rules, and two-way sync.

Company News
Socket won two 2026 Reppy Awards from RepVue, ranking in the top 5% of all sales orgs. AE Alexandra Lister shares what it's like to grow a sales career here.

Security News
NIST will stop enriching most CVEs under a new risk-based model, narrowing the NVD's scope as vulnerability submissions continue to surge.