Security News
Package Maintainers Call for Improvements to GitHub’s New npm Security Plan
Maintainers back GitHub’s npm security overhaul but raise concerns about CI/CD workflows, enterprise support, and token management.
ember-perf-timeline
Advanced tools
Add performance information to Chrome's Timeline for Ember applications.
Currently this addon provides information for Component and {{outlet}} render, although more support can (and should) be added in the future.

Warning: Running with the profiler and instrumentation enabled will itself impede performance itself. Also, be sure to test in production mode or all the development mode assertions will affect performance as well.
ember install ember-perf-timeline_ember-perf-timeline=true to the queryString of your URL.Note: If the query param is not set, the addon will not impact your app's performance, and can be left installed for production. Additionally, if the query param is set, the instrumentation overhead may be non-trivial.
The _ember-perf-timeline query param can be either true or a , separated list.
For example, ?_ember-perf-timeline=render.component,render.outlet will enable instrumentation for render.component and render.outlet but ignoring other available instrumentations. ?_ember-perf-timeline=true will enable all available instrumentations.
You can also configure your app's environment to always enable instrumentations in development mode. This can prevent route transitions clearing the queryParam.
module.exports = function(environment) {
  let ENV = {
    // ...
  };

  if (environment === 'development') {
    ENV.emberPerfTimeline = {
      renderComponent: true,
      renderOutlet: true,
      renderGetComponentDefinition: true
    }
  }

  if (environment === 'production') {
  }

  return ENV;
};
Times for a given component include its own time and those of its children. For the following example, the parent component took a total of 6 ms, which includes the 1.5ms of the child:

ember s in this repo.

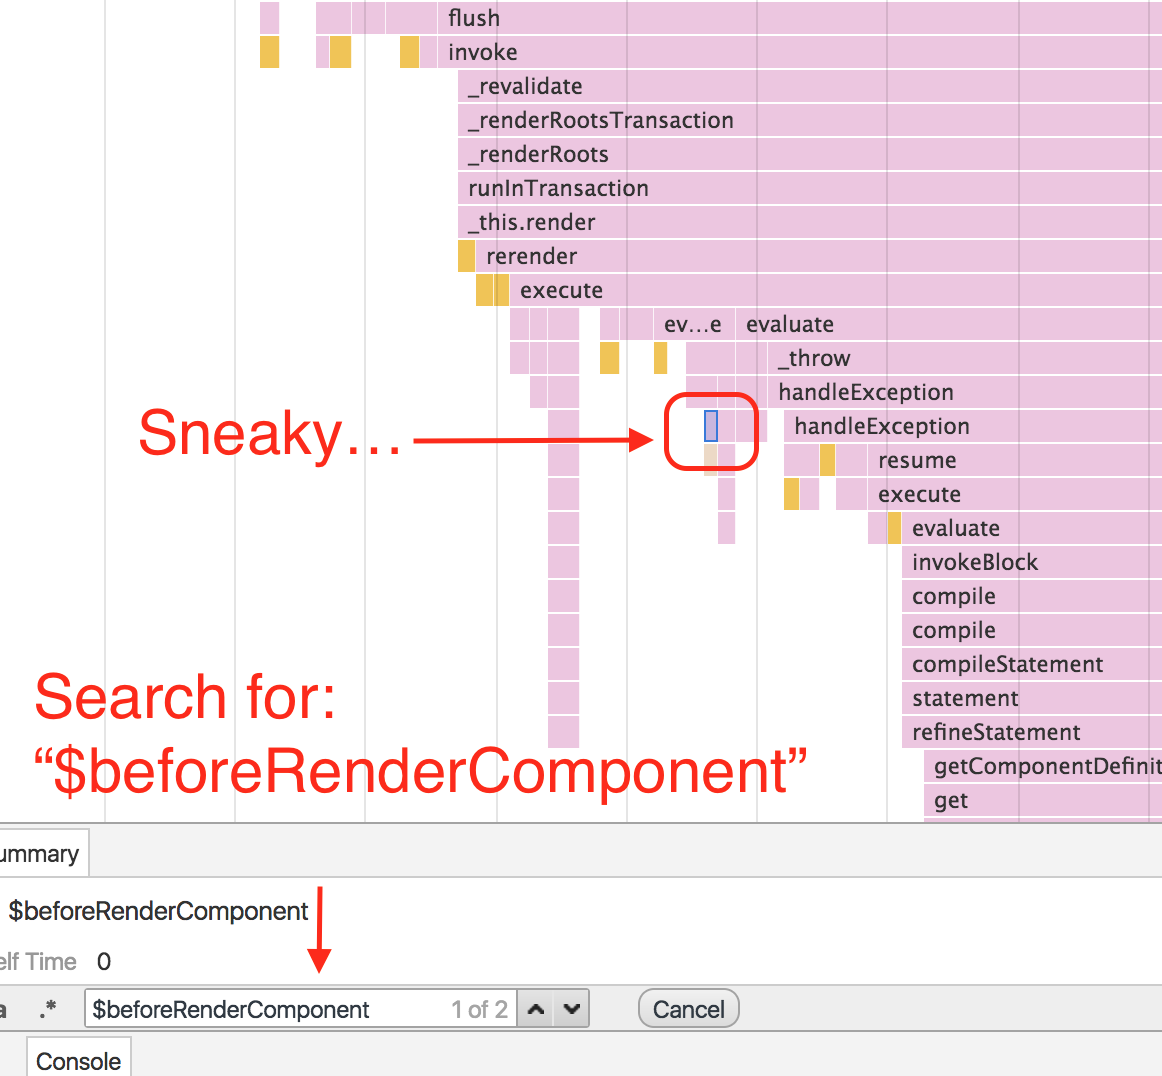
$beforeRenderComponent and $afterRenderComponent, to find the bounds of component renderings within the flame graph:
Note: Searching is limited to the visibile portion of the timeline.
ember servenpm test (Runs ember try:each to test your addon against multiple Ember versions)ember testember test --serverember buildFor more information on using ember-cli, visit https://ember-cli.com/.
FAQs
The default blueprint for ember-cli addons.
The npm package ember-perf-timeline receives a total of 434 weekly downloads. As such, ember-perf-timeline popularity was classified as not popular.
We found that ember-perf-timeline demonstrated a not healthy version release cadence and project activity because the last version was released a year ago. It has 4 open source maintainers collaborating on the project.
Did you know?

Socket for GitHub automatically highlights issues in each pull request and monitors the health of all your open source dependencies. Discover the contents of your packages and block harmful activity before you install or update your dependencies.

Security News
Maintainers back GitHub’s npm security overhaul but raise concerns about CI/CD workflows, enterprise support, and token management.

Product
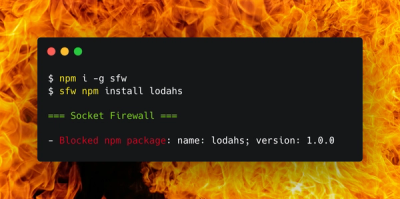
Socket Firewall is a free tool that blocks malicious packages at install time, giving developers proactive protection against rising supply chain attacks.

Research
Socket uncovers malicious Rust crates impersonating fast_log to steal Solana and Ethereum wallet keys from source code.