flame-chart-js

Installation
npm i flame-chart-js
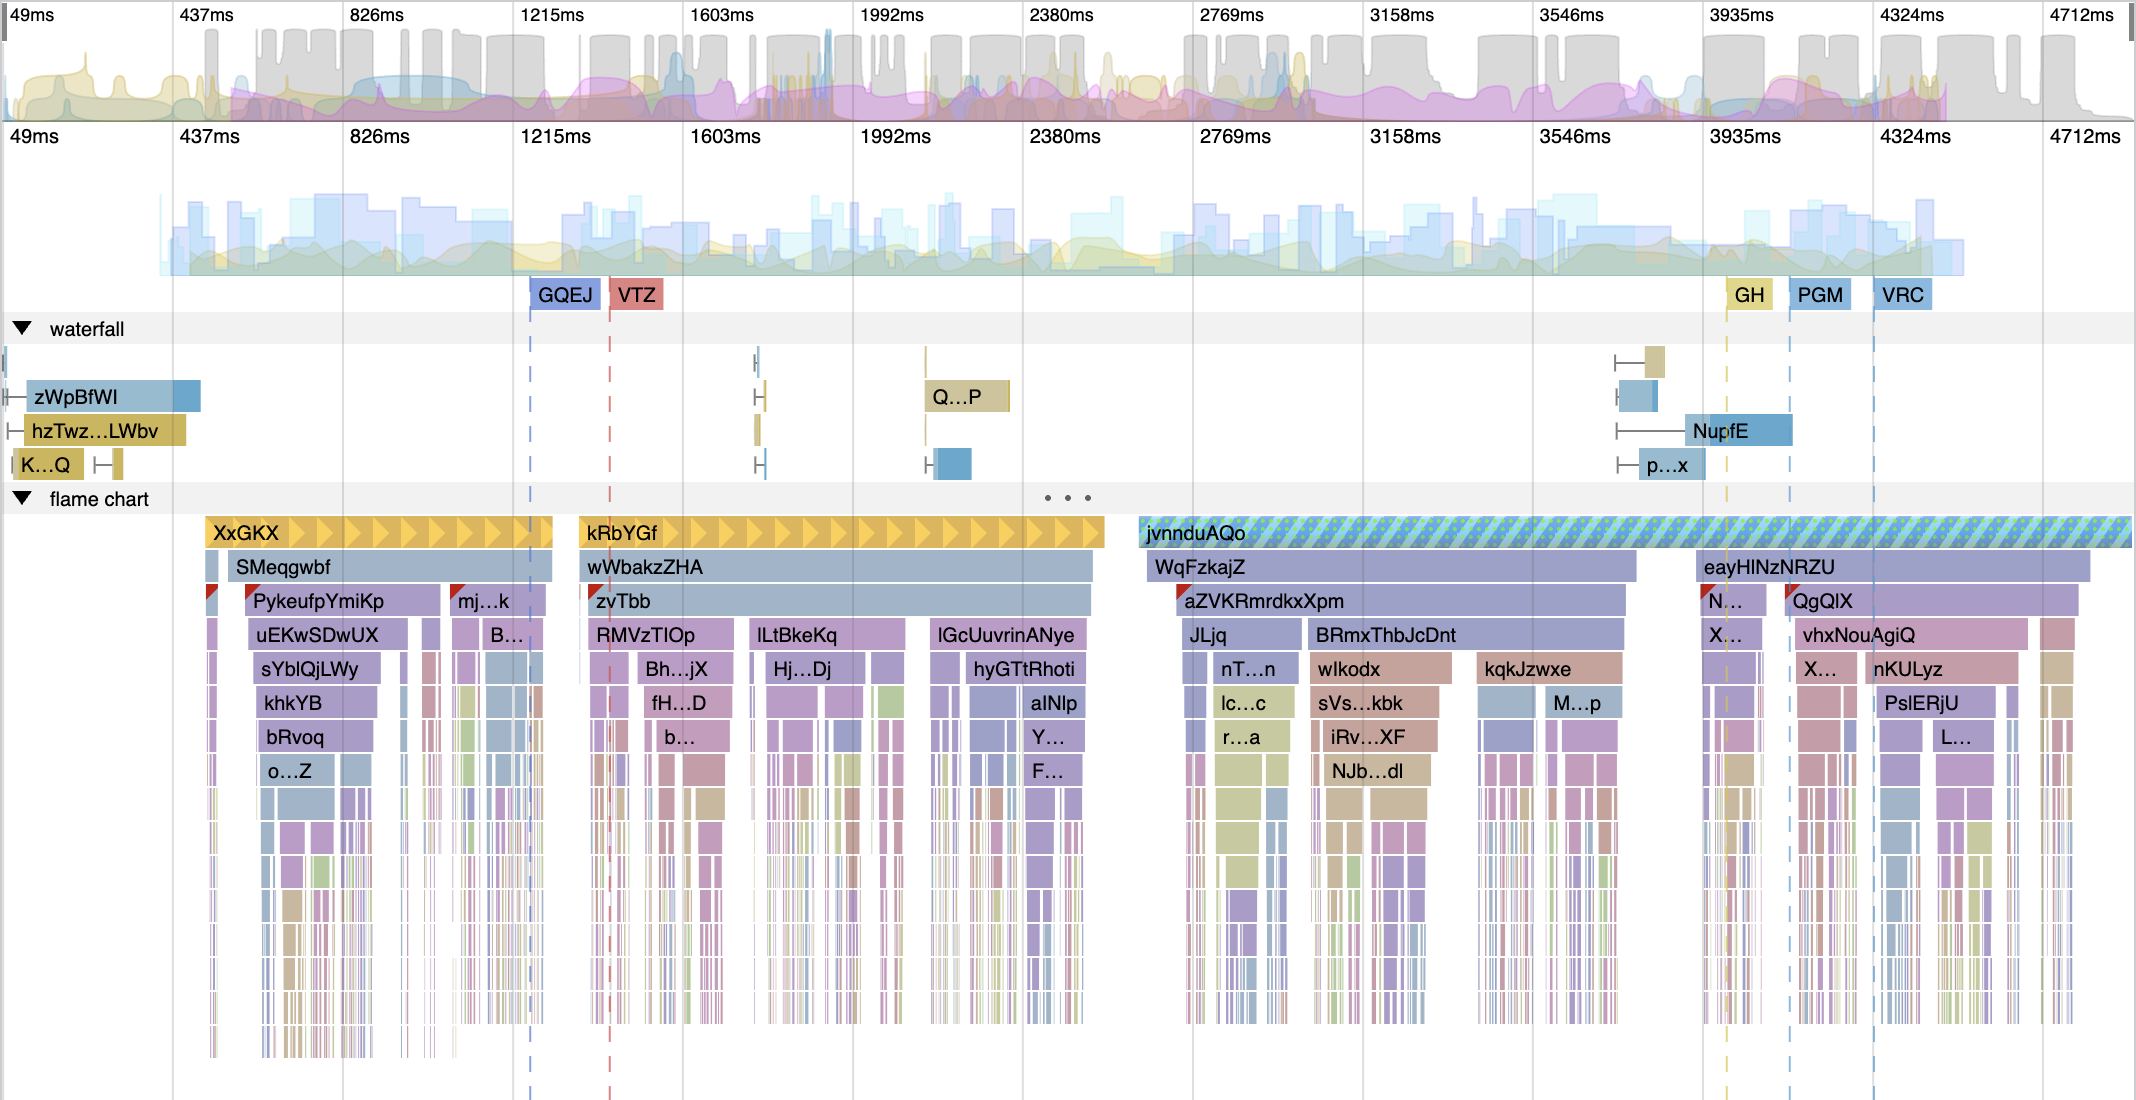
Demo
https://pyatyispyatil.github.io/flame-chart-js
Roadmap
You can find some plans on the wiki
Usage
Initialization
You can ignore any of the marks, data, or waterfall arguments to initialize only the items you want. The flame chart will automatically adjust and hide unused plugins.
import { FlameChart } from 'flame-chart-js';
const canvas = document.getElementById('canvas');
canvas.width = 800;
canvas.height = 400;
const flameChart = new FlameChart({
canvas,
data: [
{
name: 'foo',
start: 300,
duration: 200,
type: 'task',
children: [
{
name: 'foo',
start: 310,
duration: 50,
type: 'sub-task',
color: '#AA0000',
},
],
},
],
marks: [
{
shortName: 'DCL',
fullName: 'DOMContentLoaded',
timestamp: 500,
},
],
waterfall: {
},
timeseries: [],
timeframeTimeseries: [],
colors: {
task: '#FFFFFF',
'sub-task': '#000000',
},
settings: {
hotkeys: {
active: true,
scrollSpeed: 0.5,
zoomSpeed: 0.001,
fastMultiplayer: 5,
},
options: {
tooltip: () => {
},
timeUnits: 'ms',
},
styles: customStyles,
},
});
flameChart.on('select', (node, type) => {
});
Public methods
class FlameChart {
setZoom = (start: number, end: number) => boolean
setFlameChartPosition = ({ x: number, y: number }) => void 0
render = () => void 0
setNodes = (nodes: FlameChartNodes) => void 0
setMarks = (data: Marks) => void 0
setTimeseries = (data: Timeseries) => void 0
resize = (width: number, height: number) => void 0
setSettings = (settings: Object) => void 0
hotkeys = (status: boolean) => void 0
}
Usage with plugins
import { FlameChartContainer, TimeGridPlugin, MarksPlugin, FlameChartPlugin } from 'flame-chart-js';
const canvas = document.getElementById('canvas');
canvas.width = 800;
canvas.height = 400;
const flameChart = new FlameChartContainer({
canvas,
plugins: [
new TimeGridPlugin({ styles: timeGridPluginStyles }),
new MarksPlugin({ data: marks }),
new FlameChartPlugin({ data: flameChartData1, colors: flameChartColors, name: 'flameChart1' }),
new FlameChartPlugin({ data: flameChartData2, colors: flameChartColors, name: 'flameChart2' }),
],
});
Usage with React
Default flame chart:
import { FlameChartComponent } from 'flame-chart-js/react';

export const DefaultFlameChart = ({
    flameChartData,
    stylesSettings,
    onSelect,
}) => {
    const settings = useMemo(
        () => ({
            styles: stylesSettings,
        }),
        [stylesSettings],
    );

    return (
        <FlameChartComponent
            data={flameChartData}
            settings={settings}
            onSelect={onSelect}
            className={styles.flameChart}
        />
    );
};
Custom flame chart:
import { FlameChartContainerComponent } from 'flame-chart-js/react';

const CustomFlameChart = ({ flameChartData, stylesSettings }) => {
  const plugins = useMemo(() => {
    return [
      new TimeGridPlugin(),
      new TogglePlugin('FlameChart 1'),
      new FlameChartPlugin({
        name: 'flameChart1',
        data: flameChartData[0],
      }),
      new TogglePlugin('FlameChart 2'),
      new FlameChartPlugin({
        name: 'flameChart2',
        data: flameChartData[1],
      }),
    ];
  }, [flameChartData]);

  const settings = useMemo(
    () => ({
      styles: stylesSettings,
    }),
    [stylesSettings],
  );

  return <FlameChartContainerComponent settings={settings} plugins={plugins} className={styles.flameChart} />;
};
Settings
Patterns
For each span, it is possible to set their display style.
To do this, you need to define these styles using pattern settings.
const flameChart = new FlameChart({
settings: {
patterns: [
{
name: 'your-pattern-name',
pattern: 'stripes',
config: { }
}
]
}
});
Next, you need to specify the name of the created pattern in one of the nodes in data.
const node = {
    name: 'your-node-name',
    start: 0,
    duration: 100,
    type: 'your-node-type',
    pattern: 'your-pattern-name',
}
or in waterfall interval
const interval = {
    name: 'your-interval-name',
    type: 'block',
    start: 'your-start-timing-name',
    end: 'your-end-timing-name',
    pattern: 'your-pattern-name',
}
Default patterns
Stripes
type StripesPattern = {
type: 'stripes',
name: string,
config: {
color?: string,
background?: string,
lineWidth?: number,
spacing?: number,
angle?: number,
dash: number[],
}
}
Dots
type DotsPattern = {
type: 'dots',
name: string,
config: {
color?: string;
background?: string;
size?: number;
rows?: number;
align?: 'center' | 'top' | 'bottom';
spacing?: number;
verticalSpicing?: number;
horizontalSpicing?: number;
}
}
Gradient
type GradientPattern = {
type: 'gradient',
name: string,
config: {
colors: {
offset: number;
color: string
}[]
}
}
Triangles
type TrianglesPattern = {
type: 'triangles',
name: string,
config: {
color?: string;
background?: string;
width?: number;
height?: number;
align?: 'center' | 'top' | 'bottom';
direction?: 'top' | 'bottom' | 'left' | 'right' | 'top-left' | 'top-right' | 'bottom-left' | 'bottom-right';
spacing?: number;
}
}
Combined
A combined pattern will allow you to combine several patterns.
For each pattern, you can use transparency using the color or
background config option (color: 'rgba(75, 25, 10, 0.5)') and then
you will get a beautiful layering of layers on top of each other.
type CombinedPattern = {
type: 'combined',
name: string,
config: Array<StripesPattern | DotsPattern | GradientPattern | TrianglesPattern>
}
Custom
You can also create your own pattern.
import FlameChart from './flame-chart';
const flameChart = new FlameChart({
settings: {
patterns: [
{
name: 'your-pattern-name',
creator: (engine) => {
const canvas = document.createElement('canvas')!;
const ctx = canvas.getContext('2d')!;
canvas.width = 20;
canvas.height = engine.blockHeight;
ctx.fillStyle = 'red';
ctx.fillRect(0, 0, 10, 10);
return {
pattern: engine.ctx.createPattern(canvas, 'repeat')!,
}
}
}
]
}
});
Styles
You can override whatever style you want. For example:
const flameChart = new FlameChart({
    settings: {
        styles: {
            'main': {
                'blockHeight': 20
            }
        }
    }
});
After applying this style, the blocks of the flame chart will be 20 pixels high instead of 16 pixels.
To learn more about styles, you can take a look at the example -
all styles will be available in one of the dropdowns on the left side of the interface.
Custom Tooltip
You can override or prevent the tooltip render by defining this within the settings objet.
const flameChart = new FlameChart({
    settings: {
        options: {
            tooltip: undefined
        }
    }
});
For example:
chart.setSettings({ options: { tooltip: false } });
chart.setSettings({
options: {
tooltip: (data, renderEngine, mouse) => undefined,
},
});
type Mark = {
shortName: string;
fullName: string;
timestamp: number;
color: string;
};
type Marks = Array<Mark>;
type Node = {
name: string;
start: number;
duration: number;
type?: string;
color?: string;
pattern?: string;
badge?: string;
children?: Array<Node>;
};
type Nodes = Array<Node>;
type WaterfallItems = Array<{
name: string;
intervals: string | WaterfallInterval;
timing: {
[string: key]: number;
};
}>;
type WaterfallInterval = {
name: string;
color: string;
pattern?: string;
type: 'block' | 'line';
start: string;
end: string;
timeframeChart: boolean | string;
};
type WaterfallIntervals = {
[string: intervalName]: WaterfallInterval;
};
type Waterfall = {
items: WaterfallItems;
intervals: WaterfallIntervals;
};
type TimeseriesChart = {
points: [number, number][];
group?: string;
units?: string;
name?: string;
style?: Partial<ChartStyle>;
min?: number;
max?: number;
dynamicMinMax?: boolean;
};
type Timeseries = TimeseriesChart[];
Updating
flameChart.setData(newData);
flameChart.setMarks(newMarks);
flameChart.setWaterfall(newWaterfall);
flameChart.setTimeseries(newTimeseries);
Scaling
window.addEventListener('resize', () => {
    flameChart.resize(window.innerWidth, window.innerHeight);
});
Plugins
You can create your own plugin
import { UIPlugin } from 'flame-chart-js';
class MyPlugin extends UIPlugin {
constructor({ name = 'myOwnPlugin' }) {
super(name);
}
height = 100;
override render() {
this.renderEngine.addRect({ color: 'red', x: 10, y: 10, w: 20 });
}
}
Local Development
npm i && npm start