graphicjs
This is a module for manipulating media elements and for graphics processing.
Installation
npm install graphicjs;
API
API Documentation
Changelog
Changelog
Examples
There are some examples in "./examples" in this package.Here is the first one to get you started.
Usage
Actual dimensions of media elements.
import graphicjs from 'graphicjs';
graphicjs.getMediaDimensions(document.querySelector('img'));
graphicjs.getMediaDimensions(document.querySelector('video'));
Load state of media elements.
import graphicjs from 'graphicjs';
graphicjs.isMediaLoaded(document.querySelector('img'));
graphicjs.isMediaLoaded(document.querySelector('video'));
Wait for the media element to finish loading.
import graphicjs from 'graphicjs';
await graphicjs.awaitMediaLoaded(document.querySelector('img'));
await graphicjs.isMediaLoaded(document.querySelector('video'));
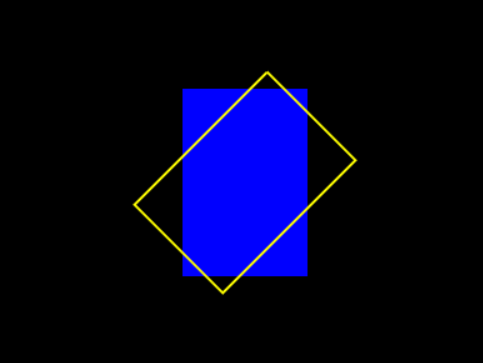
Get the coordinates of the rotated rectangle.
<canvas id="myCanvas" width="400" height="300" style="background: black;"></canvas>
import graphicjs from 'graphicjs';
const myCanvas = document.querySelector('#myCanvas');
const ctx = myCanvas.getContext('2d');
const x = 150;
const y = 75;
const width = 100;
const height = 150;
ctx.fillStyle = 'blue';
ctx.fillRect(x, y, width, height);
const degree = 45;
const coordinates = graphicjs.getRotatedRectCoordinates(x, y, width, height, degree);
ctx.beginPath();
ctx.moveTo(coordinates[0].x, coordinates[0].y);
ctx.lineTo(coordinates[1].x, coordinates[1].y);
ctx.lineTo(coordinates[2].x, coordinates[2].y);
ctx.lineTo(coordinates[3].x, coordinates[3].y);
ctx.lineTo(coordinates[0].x, coordinates[0].y);
ctx.lineWidth = 2;
ctx.strokeStyle = 'yellow';
ctx.stroke();
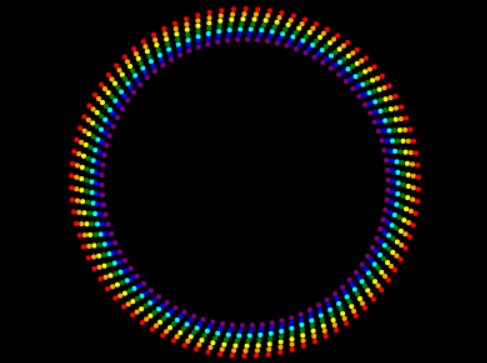
Get rotated coordinates
<canvas id="myCanvas" width="400" height="300" style="background: black;"></canvas>
import graphicjs from 'graphicjs';
const myCanvas = document.querySelector('#myCanvas');
const cx = parseInt(myCanvas.width, 10) / 2;
const cy = parseInt(myCanvas.height, 10) / 2;
const x = 80;
const y = 80;
const pointColors = [ 'red', 'orange', 'yellow', 'green', 'aqua', 'blue', 'purple' ]
for (let i=0; i<pointColors.length; i++) {
for (let degree=0; degree<360; degree+=4) {
const coordinate = graphicjs.getRotationCoordinate(x + i*3, y + i*3, cx, cy , degree);
graphicjs.drawPoint(myCanvas, coordinate.x, coordinate.y, { radius: 2, color: pointColors[i] });
}
}
Get the center of multiple coordinates.
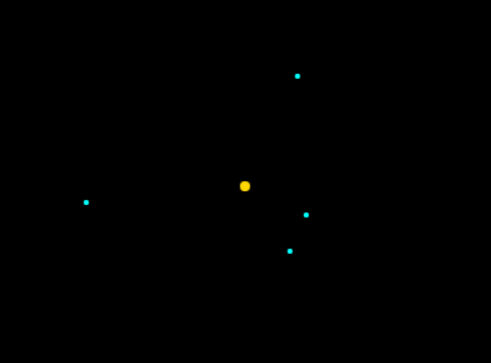
<canvas id="myCanvas" width="400" height="300" style="background: black;"></canvas>
import graphicjs from 'graphicjs';
function randInt(min, max) {
min = Math.ceil(min);
max = Math.floor(max);
return Math.floor(Math.random() * (max - min)) + min;
}
function randCoordinates(numberOfCoordinates) {
const maxX = parseInt(document.querySelector('#myCanvas').width, 10);
const maxY = parseInt(document.querySelector('#myCanvas').height, 10);
return [...Array(numberOfCoordinates)].map(_ => ({ x: randInt(1, maxX), y: randInt(1, maxY) }));
}
const myCanvas = document.querySelector('#myCanvas');
const coordinates = randCoordinates(4);
for (let { x, y } of coordinates) graphicjs.drawPoint(myCanvas, x, y, { radius: 2, color: 'cyan' });
const { x, y } = graphicjs.getCenterCoordinate(...coordinates);
graphicjs.drawPoint(myCanvas, x, y, { radius: 4, color: 'gold' });
Get the angle of two coordinates.
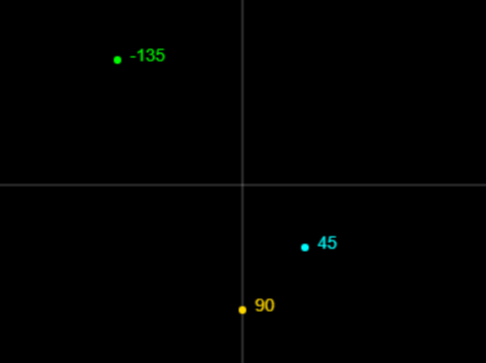
<canvas id="myCanvas" width="400" height="300" style="background: black;"></canvas>
import graphicjs from 'graphicjs';
const myCanvas = document.querySelector('#myCanvas');
const ctx = myCanvas.getContext('2d');
const cx = parseInt(myCanvas.width, 10) / 2;
const cy = parseInt(myCanvas.height, 10) / 2;
graphicjs.drawLine(myCanvas, 0, cy, parseInt(myCanvas.width, 10), cy, { color: 'white', lineWidth: .5 });
graphicjs.drawLine(myCanvas, cx, 0, cx, parseInt(myCanvas.height, 10), { color: 'white', lineWidth: .5 });
let x = cx + 50;
let y = cy + 50;
graphicjs.drawPoint(myCanvas, x, y, { color: 'aqua' });
let degree = graphicjs.getAngleBetweenCoordinates(cx, cy, x, y);
graphicjs.drawText(myCanvas, degree, x + 10, y - 10, { color: 'aqua' });
x = cx + 0;
y = cy + 100;
graphicjs.drawPoint(myCanvas, x, y, { color: 'gold' });
degree = graphicjs.getAngleBetweenCoordinates(cx, cy, x, y);
graphicjs.drawText(myCanvas, degree, x + 10, y - 10, { color: 'gold' });
x = cx - 100;
y = cy - 100;
graphicjs.drawPoint(myCanvas, x, y, { color: 'lime' });
degree = graphicjs.getAngleBetweenCoordinates(cx, cy, x, y);
graphicjs.drawText(myCanvas, degree, x + 10, y - 10, { color: 'lime' });
Get the distance between two coordinates.
import graphicjs from 'graphicjs';
graphicjs.getDistance(0, 0, 200, 150);
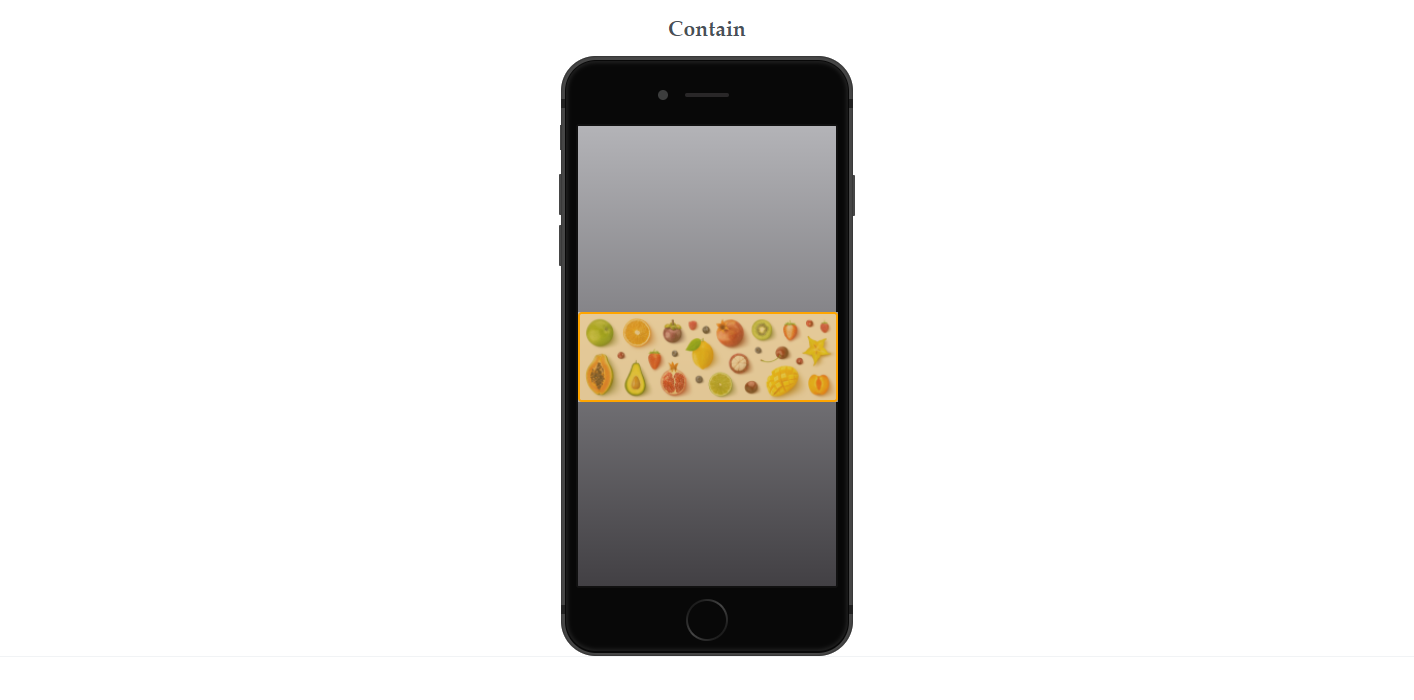
Fit media element dimensions to parent.
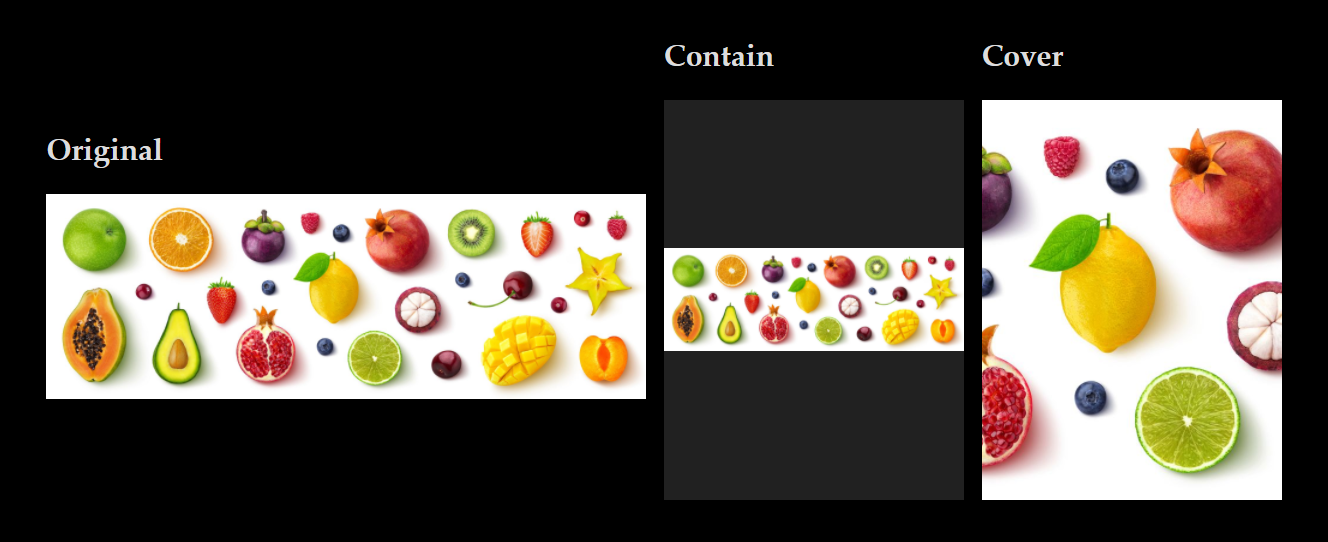
<h1>Original</h1><img src="sample.png">
<h1>Contain</h1><div id="parent1" style="width: 320px; height: 240px;"><img id="img1" src="sample.png"></div>
<h1>Cover</h1><div id="parent2" style="width: 320px; height: 240px;"><img id="img2" src="sample.png"></div>

import graphicjs from 'graphicjs';

// Contain
graphicjs.fitParent(document.querySelector('#img1'), document.querySelector('#parent1'), 'contain');

// Cover
graphicjs.fitParent(document.querySelector('#img2'), document.querySelector('#parent2'), 'cover');
Get the rendering area of the media.
Returns a bounding box for the visible region relative to the actual size of the media.
If the "object-fit" of the media element is "cover", the bounding box points to the orange part of the image below.
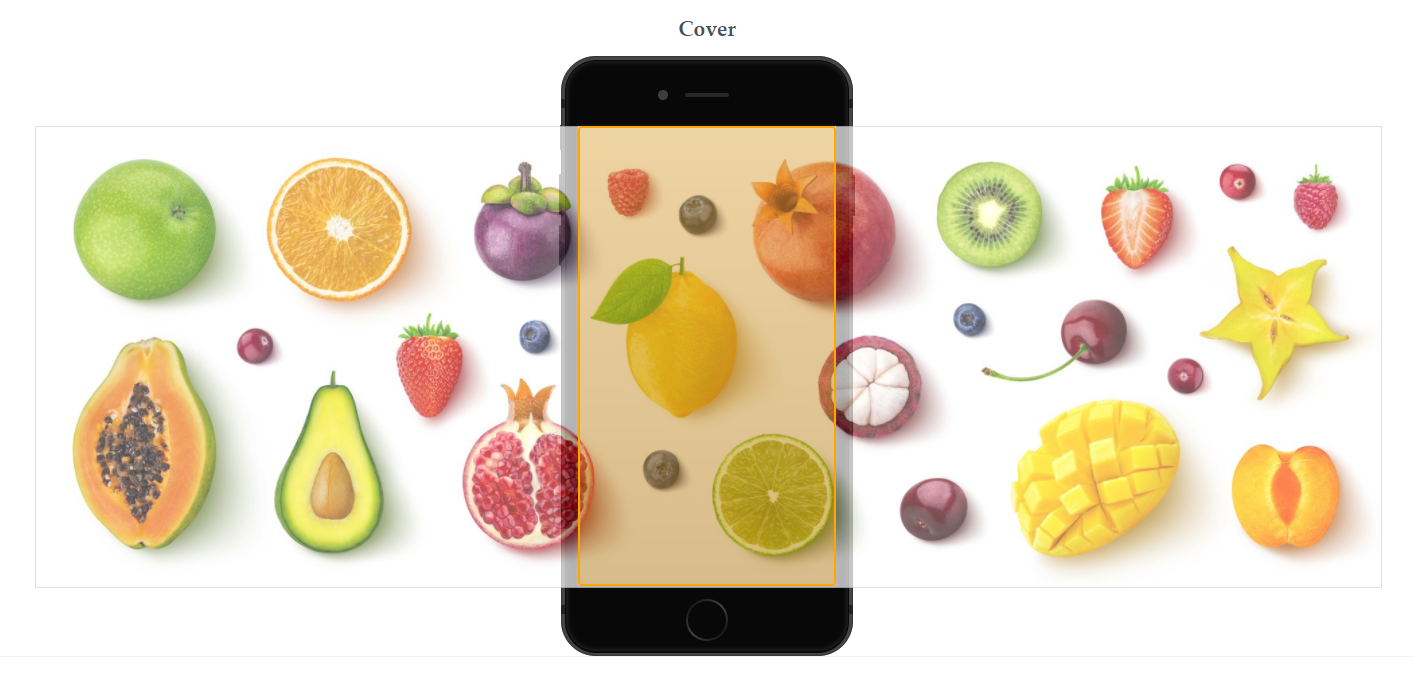
Also, if the "object-fit" of the media element is "contain", the bounding box points to the orange part of the image below.
import graphicjs from 'graphicjs';
graphicjs.getRenderClientRect(document.querySelector('video'));
Draw a point.
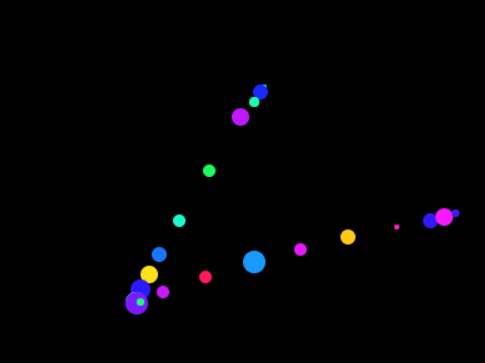
<canvas id="myCanvas" width="400" height="300" style="background: black;"></canvas>
import graphicjs from 'graphicjs';
function randInt(min, max) {
min = Math.ceil(min);
max = Math.floor(max);
return Math.floor(Math.random() * (max - min)) + min;
}
function randColor() {
return `hsl(${Math.random() * 360}, 100%, 55%)`;
}
const myCanvas = document.querySelector('#myCanvas');
myCanvas.addEventListener('mousemove', e => {
const radius = randInt(1, 10);
const color = randColor();
graphicjs.drawPoint(myCanvas, e.offsetX, e.offsetY, { radius, color });
});
Draw a point in the center at multiple coordinates.
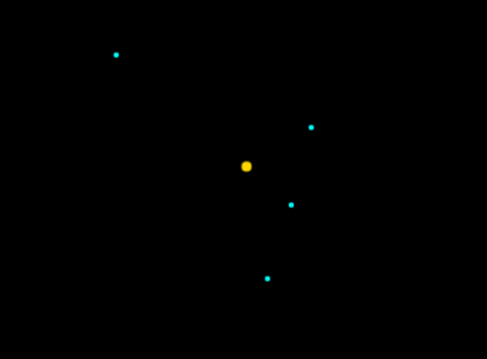
<canvas id="myCanvas" width="400" height="300" style="background: black;"></canvas>
import graphicjs from 'graphicjs';
function randInt(min, max) {
min = Math.ceil(min);
max = Math.floor(max);
return Math.floor(Math.random() * (max - min)) + min;
}
function randCoordinates(numberOfCoordinates) {
const maxX = parseInt(document.querySelector('#myCanvas').width, 10);
const maxY = parseInt(document.querySelector('#myCanvas').height, 10);
return [...Array(numberOfCoordinates)].map(_ => ({ x: randInt(1, maxX), y: randInt(1, maxY) }));
}
const myCanvas = document.querySelector('#myCanvas');
const coordinates = randCoordinates(4);
for (let { x, y } of coordinates) graphicjs.drawPoint(myCanvas, x, y, { radius: 2, color: 'cyan' });
graphicjs.drawCenterPoint(myCanvas, coordinates, { radius: 4, color: 'gold' });
Draw a rectangle.
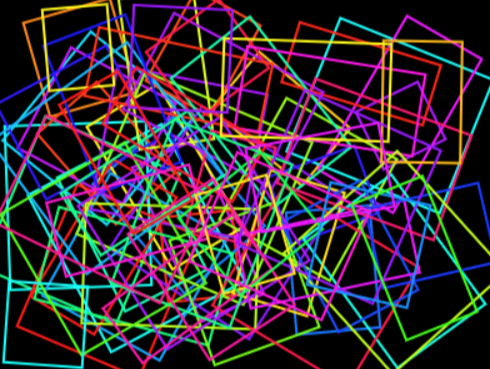
<canvas id="myCanvas" width="400" height="300" style="background: black;"></canvas>
import graphicjs from 'graphicjs';
function randColor() {
return `hsl(${Math.random() * 360}, 100%, 55%)`;
}
function randInt(min, max) {
min = Math.ceil(min);
max = Math.floor(max);
return Math.floor(Math.random() * (max - min)) + min;
}
const myCanvas = document.querySelector('#myCanvas');
const canvasWidth = parseInt(myCanvas.width, 10);
const canvasHeight = parseInt(myCanvas.height, 10);
for (let i=0; i<70; i++) {
const width = randInt(50, 150);
const height = randInt(50, 150);
const x = randInt(0, canvasWidth - width);
const y = randInt(0, canvasHeight - height);
const lineColor = randColor();
const degree = randInt(0, 360);
graphicjs.drawRectangle(myCanvas, x, y, width, height, { lineColor, degree });
}
Draw the corners of a rectangle.
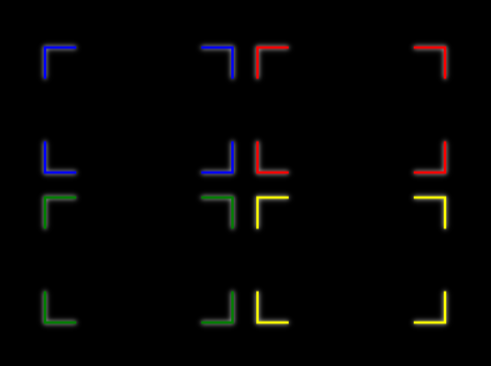
<canvas id="myCanvas" width="400" height="300" style="background: black;"></canvas>
import graphicjs from 'graphicjs';
const myCanvas = document.querySelector('#myCanvas');
const shadowColor = 'white';
const shadowBlur = 4;
graphicjs.drawRectangleCorners(myCanvas, 40, 40, 150, 100, { lineColor: 'blue', shadowBlur, shadowColor });
graphicjs.drawRectangleCorners(myCanvas, 210, 40, 150, 100, { lineColor: 'red', shadowBlur, shadowColor });
graphicjs.drawRectangleCorners(myCanvas, 40, 160, 150, 100, { lineColor: 'green', shadowBlur, shadowColor });
graphicjs.drawRectangleCorners(myCanvas, 210, 160, 150, 100, { lineColor: 'yellow', shadowBlur, shadowColor });
Draw a string on the canvas.
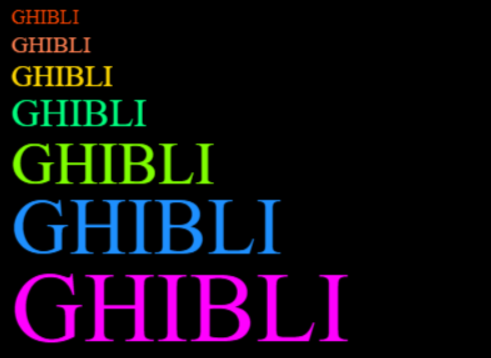
<canvas id="myCanvas" width="400" height="300" style="background: black;"></canvas>
import graphicjs from 'graphicjs';
const myCanvas = document.querySelector('#myCanvas');
graphicjs.drawText(myCanvas, 'GHIBLI', 10, 10, { font: '1em Times New Roman', color: 'orangered' });
graphicjs.drawText(myCanvas, 'GHIBLI', 10, 31, { font: '1.17em Times New Roman', color: 'coral' });
graphicjs.drawText(myCanvas, 'GHIBLI', 10, 54, { font: '1.5em Times New Roman', color: 'gold' });
graphicjs.drawText(myCanvas, 'GHIBLI', 10, 80, { font: '2em Times New Roman', color: 'springgreen' });
graphicjs.drawText(myCanvas, 'GHIBLI', 10, 113, { font: '3em Times New Roman', color: 'chartreuse' });
graphicjs.drawText(myCanvas, 'GHIBLI', 10, 157, { font: '4em Times New Roman', color: 'dodgerblue' });
graphicjs.drawText(myCanvas, 'GHIBLI', 10, 215, { font: '5em Times New Roman', color: 'fuchsia' });
Draw a line.
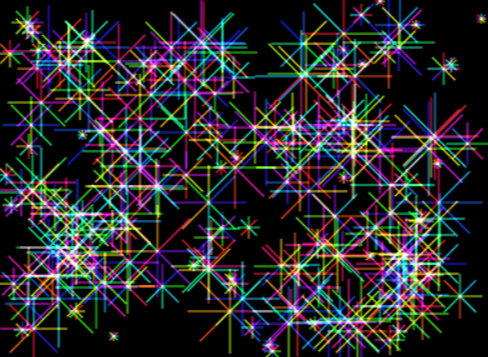
<canvas id="myCanvas" width="400" height="300" style="background: black;"></canvas>
import graphicjs from 'graphicjs';
function randInt(min, max) {
min = Math.ceil(min);
max = Math.floor(max);
return Math.floor(Math.random() * (max - min)) + min;
}
function randColor() {
return `hsl(${Math.random() * 360}, 100%, 55%)`;
}
function drawSpark() {
const rad = Math.PI * 2 / 8;
const radius = randInt(4, 40);
const x = randInt(radius, parseInt(myCanvas.width, 10) - radius);
const y = randInt(radius, parseInt(myCanvas.height, 10) - radius);
for (let i=1; i<9; i++) {
graphicjs.drawLine(myCanvas,
x,
y,
Math.cos(rad * i) * radius + x,
Math.sin(rad * i) * radius + y,
{ color: randColor() });
}
}
const myCanvas = document.querySelector('#myCanvas');
myCanvas.getContext('2d').globalCompositeOperation = 'lighter';
for (let i=0; i<196; i++) drawSpark();
Crop in a circle.
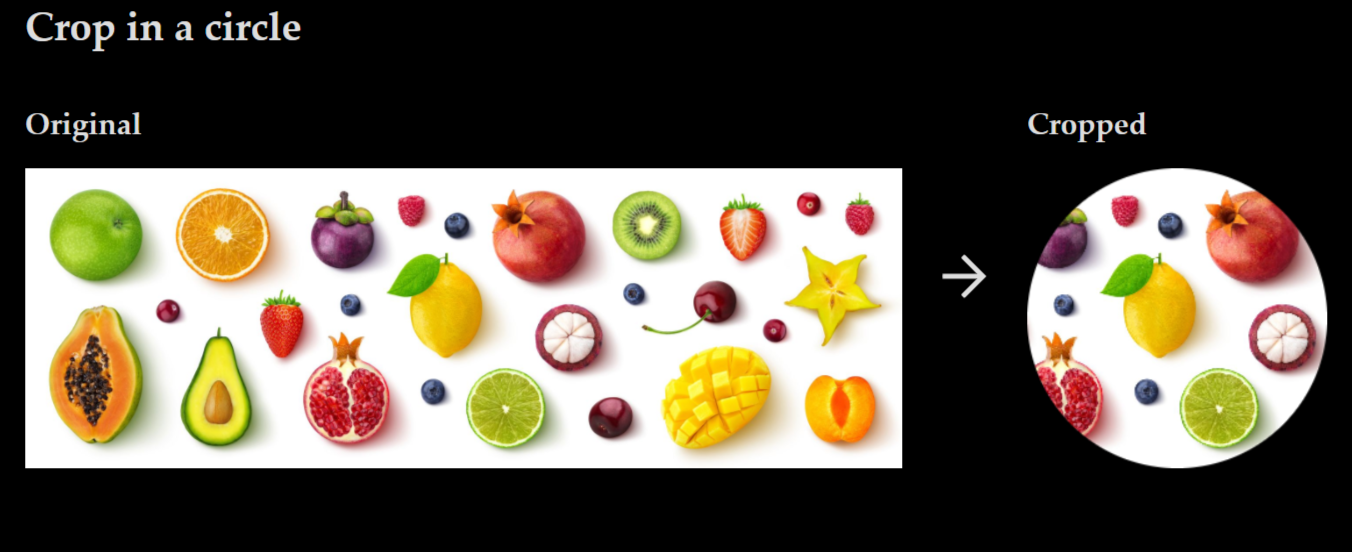
<canvas id="canvas"></canvas>
import graphicjs from 'graphicjs';
const croppedImg = await graphicjs.cropCircle('sample.jpg', { size: 240 });
const canvas = document.querySelector('#canvas');
canvas.width = croppedImg.width;
canvas.height = croppedImg.height;
canvas.getContext('2d').drawImage(croppedImg, 0, 0);
Dimensions of the area where the string is drawn.
import graphicjs from 'graphicjs';
graphicjs.getTextDimensions('Hello World');
graphicjs.getTextDimensions('Hello World', '14px Arial');
License
MIT licensed