
Security News
Crates.io Users Targeted by Phishing Emails
The Rust Security Response WG is warning of phishing emails from rustfoundation.dev targeting crates.io users.
By Sarah Gooding - Sep 12, 2025
instrument-this
Advanced tools
Effortlessly add tracing and metrics to your Node services with an @Instrument decorator.
Install instrument-this from NPM:
npm install --save instrument-this
Initialize OpenTelemetry tracing the usual way, get a TracerProvider:
// Initialize a TraceExporter...
const tracerProvider = new NodeTracerProvider();
// Initialize other instrumentations like HTTP, gRPC etc.
tracerProvider.addSpanProcessor(new SimpleSpanProcessor(exporter));
tracerProvider.register();
This library provides OpenTelemetry and Prometheus-based metrics providers.
const promMetricsProvider = new PromMetricsProvider();
You can also provide your own metrics provider by implementing the MetricsProvider interface.
After initializing OpenTelemetry and a MetricsProvider, the last step is to call initializeInstrumentation like this, and you're ready to go.
import { Instrument, initializeInstrumentation } from 'instrument-this';

initializeInstrumentation({
    processName: 'example',
    tracer: tracerProvider.getTracer('example'),
    metricsProvider: promMetricsProvider,
});
@InstrumentSimply add the @Instrument() decorator to your method. This creates a tracing span, as well as histogram and summary metrics to measure the execution of the method. If an exception is thrown inside the method, the span is marked with an error.
class MyService {

    @Instrument()
    async loadItems(count: number): Promise<Item> {
        // do things...
    }

}
There are a few options available in the instrument decorator.
You can give the spans and metrics a different name with the name property:
class MyService {
    @Instrument({ name: 'PreferredName' })
    async myPrivateMethod() {
        // ...
    }
}
You can disable metrics creation while keeping the span, or vice versa:
@Instrument({ metrics: { enabled: false } })
@Instrument({ tracing: { enabled: false } })
You can get the registry from the metrics provider and export them from a /metrics endpoint.
const router = new KoaRouter();
router.get('/metrics', async (ctx: Context) => {
    ctx.type = 'text';
    ctx.body = await provider.getRegistry().metrics();
});
An example project can be found in the example directory.
You can start up the whole stack with docker-compose:
docker-compose -f ./example/docker-compose.yml up --build
This will build the example server image and start it up along with Jaeger, Prometheus and Grafana.
Once it's up and running, you can make requests to http://localhost:8080/ and http://localhost:8080/other
The Jaeger UI should be available at localhost:16686, where you can explore the created spans:

Grafana should be available at http://localhost:3000 (username: admin, password: admin). Once you sign in, a dashboard called Example should be available to view.

FAQs
Effortless OpenTelemetry instrumentation for Node.js
We found that instrument-this demonstrated a not healthy version release cadence and project activity because the last version was released a year ago. It has 1 open source maintainer collaborating on the project.
Did you know?

Socket for GitHub automatically highlights issues in each pull request and monitors the health of all your open source dependencies. Discover the contents of your packages and block harmful activity before you install or update your dependencies.
Security News
The Rust Security Response WG is warning of phishing emails from rustfoundation.dev targeting crates.io users.
Product
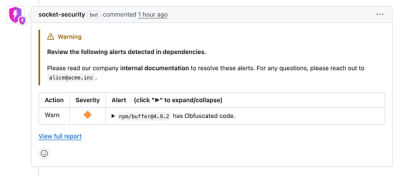
Socket now lets you customize pull request alert headers, helping security teams share clear guidance right in PRs to speed reviews and reduce back-and-forth.

Product
Socket's Rust support is moving to Beta: all users can scan Cargo projects and generate SBOMs, including Cargo.toml-only crates, with Rust-aware supply chain checks.