Product
Introducing Reachability for PHP
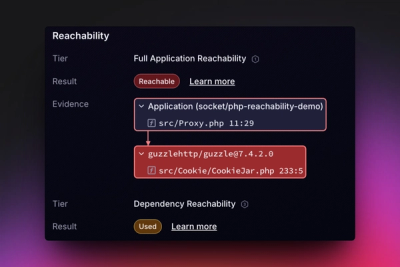
Reachability analysis for PHP is now available in experimental, helping teams identify which vulnerabilities are actually exploitable.
jaeger-client
Advanced tools
This is Jaeger's client side instrumentation library for Node.js that implements Javascript OpenTracing API 1.0.
Note that this library is not designed to run in the browser, only in the Node.js-backend servers. For browser-only version, see https://github.com/jaegertracing/jaeger-client-javascript.
See the OpenTracing tutorial for the introduction on using the OpenTracing API and the Jaeger SDK.
Please see CONTRIBUTING.md.
npm install --save jaeger-client
The Tracer defaults to sending spans over UDP to the jaeger-agent running on localhost; the jaeger-agent handles forwarding the spans to the jaeger-collector. When you are instantiating your client instance you can specify the sampler of your choice. The library support the following samplers:
| SAMPLER | KEY |
|---|---|
| Constant | const |
| Probabilistic | probabilistic |
| Rate Limiting | ratelimiting |
| Remote | remote |
More information about sampling can be found here
var initTracer = require('jaeger-client').initTracer;

// See schema https://github.com/jaegertracing/jaeger-client-node/blob/master/src/configuration.js#L37
var config = {
  serviceName: 'my-awesome-service',
};
var options = {
  tags: {
    'my-awesome-service.version': '1.1.2',
  },
  metrics: metrics,
  logger: logger,
};
var tracer = initTracer(config, options);
The tracer can be initialized with values coming from environment variables:
var tracer = initTracerFromEnv(config, options);
None of the env vars are required and all of them can be overridden via properties on the config object.
| Property | Description |
|---|---|
| JAEGER_SERVICE_NAME | The service name |
| JAEGER_AGENT_HOST | The hostname for communicating with agent via UDP |
| JAEGER_AGENT_PORT | The port for communicating with agent via UDP |
| JAEGER_AGENT_SOCKET_TYPE | The family of socket. Must be either 'udp4' or 'udp6' ('udp4' by default). |
| JAEGER_ENDPOINT | The HTTP endpoint for sending spans directly to a collector, i.e. http://jaeger-collector:14268/api/traces |
| JAEGER_USER | Username to send as part of "Basic" authentication to the collector endpoint |
| JAEGER_PASSWORD | Password to send as part of "Basic" authentication to the collector endpoint |
| JAEGER_REPORTER_LOG_SPANS | Whether the reporter should also log the spans |
| JAEGER_REPORTER_FLUSH_INTERVAL | The reporter's flush interval (ms) |
| JAEGER_REPORTER_TIMEOUT | The reporter's http timeout (ms) |
| JAEGER_SAMPLER_TYPE | The sampler type |
| JAEGER_SAMPLER_PARAM | The sampler parameter (number) |
| JAEGER_SAMPLER_MANAGER_HOST_PORT | The HTTP endpoint when using the remote sampler, i.e. http://jaeger-agent:5778/sampling |
| JAEGER_SAMPLER_REFRESH_INTERVAL | How often the remotely controlled sampler will poll jaeger-agent for the appropriate sampling strategy |
| JAEGER_TAGS | A comma separated list of name = value tracer level tags, which get added to all reported spans. The value can also refer to an environment variable using the format ${envVarName:default}, where the :default is optional, and identifies a value to be used if the environment variable cannot be found |
| JAEGER_DISABLED | Whether the tracer is disabled or not. If true, the default opentracing.NoopTracer is used. |
By default, the client sends traces via UDP to the agent at localhost:6832. Use JAEGER_AGENT_HOST and JAEGER_AGENT_PORT to send UDP traces to a different host:port. If JAEGER_ENDPOINT is set, the client sends traces to the endpoint via HTTP, making the JAEGER_AGENT_HOST and JAEGER_AGENT_PORT unused. If JAEGER_ENDPOINT is secured, HTTP basic authentication can be performed by setting the JAEGER_USER and JAEGER_PASSWORD environment variables.
UDP has a hard size limit of 65,507 bytes; if the span is larger than this limit, the tracer will drop the span. To circumvent this, you can configure the tracer to directly send spans to the jaeger-collector over HTTP (skipping the jaeger-agent altogether).
var initTracer = require('jaeger-client').initTracer;

// See schema https://github.com/jaegertracing/jaeger-client-node/blob/master/src/configuration.js#L37
var config = {
  serviceName: 'my-awesome-service',
  reporter: {
    // Provide the traces endpoint; this forces the client to connect directly to the Collector and send
    // spans over HTTP
    collectorEndpoint: 'http://jaeger-collector:14268/api/traces',
    // Provide username and password if authentication is enabled in the Collector
    // username: '',
    // password: '',
  },
};
var options = {
  tags: {
    'my-awesome-service.version': '1.1.2',
  },
  metrics: metrics,
  logger: logger,
};
var tracer = initTracer(config, options);
The metrics and logger objects shown in the above example must satisfy the MetricsFactory and Logger APIs respectively.
This module brings a Prometheus(prom-client) integration to the internal Jaeger metrics.
The way to initialize the tracer with Prometheus metrics:
var PrometheusMetricsFactory = require('jaeger-client').PrometheusMetricsFactory;
var promClient = require('prom-client');

var config = {
  serviceName: 'my-awesome-service',
};
var namespace = config.serviceName;
var metrics = new PrometheusMetricsFactory(promClient, namespace);
var options = {
  metrics: metrics,
};
var tracer = initTracer(config, options);
The Tracer instance created by initTracer is OpenTracing-1.0 compliant. See opentracing-javascript for usage examples. Ensure that tracer.close() is called on application exit to flush buffered traces.
Because tchannel-node does not have instrumentation for OpenTracing, Jaeger-Client exposes methods wrapping tchannel handlers, and encoded channels. An encoded channel is a channel wrapped in either a thrift encoder TChannelAsThrift, or json encoder TChannelAsJson. To wrap a server handler for thrift one can initialize a tchannel bridge, and wrap the encoded handler function with a tracedHandler decorator. The tchannel bridge takes an OpenTracing tracer, and a context factory. The context factory must be a function that returns a context with the methods 'getSpan', and 'setSpan' which retrieve and assign the span to the context respectively.
import { TChannelBridge } from 'jaeger-client';
import Context from 'some-conformant-context';

function contextFactory() {
  return new Context();
}

let bridge = new TChannelBridge(tracer, { contextFactory: contextFactory });
let server = new TChannel({ serviceName: 'server' });
server.listen(4040, '127.0.0.1');
let serverThriftChannel = TChannelAsThrift({
  channel: server,
  entryPoint: path.join(__dirname, 'thrift', 'echo.thrift'), // file path to a thrift file
});

let perProcessOptions = {};
serverThriftChannel.register(
  server,
  'Echo::echo',
  perProcessOptions,
  bridge.tracedHandler((perProcessOptions, req, head, body, callback) => {
    /* Your handler code goes here. */
  })
);
Outbound calls can be made in two ways, shown below.
request.send()import { TChannelBridge } from 'jaeger-client';
let bridge = new TChannelBridge(tracer);
// Create the toplevel client channel.
let client = new TChannel();
// Create the client subchannel that makes requests.
let clientSubChannel = client.makeSubChannel({
serviceName: 'server',
peers: ['127.0.0.1:4040'],
});
let encodedThriftChannel = TChannelAsThrift({
channel: clientSubChannel,
entryPoint: path.join(__dirname, 'thrift', 'echo.thrift'), // file path to a thrift file
});
// wrap encodedThriftChannel in a tracing decorator
let tracedChannel = bridge.tracedChannel(encodedThriftChannel);
// The encodedThriftChannel's (also true for json encoded channels) request object can call 'send' directly.
let req = tracedChannel.request({
serviceName: 'server',
context: context, // must be passed through from the service handler shown above
headers: { cn: 'echo' },
});
// headers should contain your outgoing tchannel headers if any.
// In this instance 'send' is being called on the request object, and not the channel.
req.send('Echo::echo', headers, { value: 'some-string' });
encodedChannel.send(request)let tracedChannel = bridge.tracedChannel(encodedThriftChannel);
// tracedChannel.channel refers to encodedThriftChannel's inner channel which
// is clientSubChannel in this instance.
let req = tracedChannel.channel.request({
serviceName: 'server',
headers: { cn: 'echo' },
context: context, // must be passed through from the service handler shown above
timeout: someTimeout,
});
// send() can be called directly on the tracing decorator
tracedChannel.send(req, 'Echo::echo', o.headers, { value: 'some-string' }, clientCallback);
The OpenTracing API defines a sampling.priority standard tag that can be used to affect the sampling of a span and its children:
span.setTag(opentracing_tags.SAMPLING_PRIORITY, 1);
Jaeger Tracer also understands a special HTTP Header jaeger-debug-id, which can be set in the incoming request, e.g.
curl -H "jaeger-debug-id: some-correlation-id" http://myhost.com
When Jaeger sees this header in the request that otherwise has no tracing context, it ensures that the new trace started for this request will be sampled in the "debug" mode (meaning it should survive all downsampling that might happen in the collection pipeline), and the root span will have a tag as if this statement was executed:
span.setTag('jaeger-debug-id', 'some-correlation-id');
This allows using Jaeger UI to find the trace by this tag.
Specify the reporter's flush interval (ms) with config.reporter.flushIntervalMs or JAEGER_REPORTER_FLUSH_INTERVAL. The default is 1000 ms.
Calling .close() on the tracer will properly flush and close composed objects, including the reporter and sampler. This prevents dropped traces in the event of an error or unexpected early termination prior to normal periodic flushing.
tracer.close(cb?)
Support for Zipkin's B3 Propagation HTTP headers is provided by the ZipkinB3TextMapCodec, which can be configured instead of the default TextMapCodec.
The new codec can be used by registering it with a tracer instance as both an injector and an extractor:
let codec = new ZipkinB3TextMapCodec({ urlEncoding: true });

tracer.registerInjector(opentracing.FORMAT_HTTP_HEADERS, codec);
tracer.registerExtractor(opentracing.FORMAT_HTTP_HEADERS, codec);
This can prove useful when compatibility with existing Zipkin tracing/instrumentation is desired.
In order to bundle the library using webpack, e.g. for uploading code to an AWS Lambda function, it is required to copy the Jaeger thrift definition file into the output directory of the bundle:
{
  plugins: [
    new CopyPlugin([
      {
        from: require.resolve('jaeger-client/dist/src/jaeger-idl/thrift/jaeger.thrift'),
        to: 'jaeger-idl/thrift/jaeger.thrift',
      },
      {
        from: require.resolve('jaeger-client/dist/src/thriftrw-idl/agent.thrift'),
        to: 'thriftrw-idl/agent.thrift',
      },
    ]),
  ];
}
The opentracing package provides a vendor-neutral API for distributed tracing. It allows developers to instrument their code with tracing information that can be used by various tracing systems, including Jaeger, Zipkin, and others. Compared to jaeger-client, opentracing is more generic and can be used with multiple tracing backends.
The zipkin package is a Node.js client for Zipkin, another distributed tracing system. It provides similar functionalities to jaeger-client, such as creating and managing spans, adding annotations, and propagating context. Zipkin is often compared to Jaeger, and the choice between them can depend on specific use cases and preferences.
The lightstep-tracer package is a Node.js client for LightStep, a commercial distributed tracing platform. It offers advanced features such as high-fidelity tracing and real-time analytics. While jaeger-client is open-source and free to use, LightStep provides additional enterprise-level features and support.
FAQs
Jaeger binding for OpenTracing API for Node.js
The npm package jaeger-client receives a total of 666,953 weekly downloads. As such, jaeger-client popularity was classified as popular.
We found that jaeger-client demonstrated a not healthy version release cadence and project activity because the last version was released a year ago. It has 5 open source maintainers collaborating on the project.
Did you know?

Socket for GitHub automatically highlights issues in each pull request and monitors the health of all your open source dependencies. Discover the contents of your packages and block harmful activity before you install or update your dependencies.

Product
Reachability analysis for PHP is now available in experimental, helping teams identify which vulnerabilities are actually exploitable.

Product
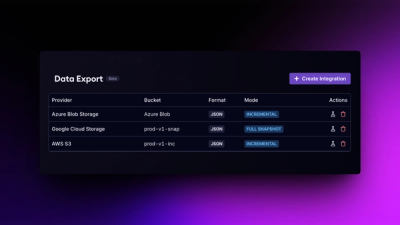
Export Socket alert data to your own cloud storage in JSON, CSV, or Parquet, with flexible snapshot or incremental delivery.

Research
/Security News
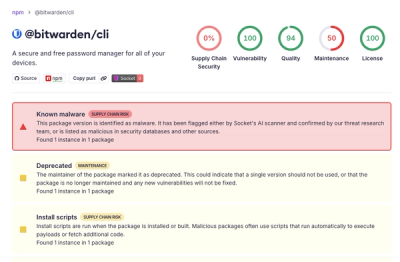
Bitwarden CLI 2026.4.0 was compromised in the Checkmarx supply chain campaign after attackers abused a GitHub Action in Bitwarden’s CI/CD pipeline.